On March 20, 2024, the US Federal Reserve released the updated Fed dot plot, which showed a projected 2.25-point interest rate cut by yearend 2026. This would reduce the fed funds target rate range from 5.25%-5.50% today to 3.00%-3.25%.
The 19 Federal Open Market Committee ("FOMC") participants also projected PCE inflation to be 2.4% at year-end 2024 and for 2024 US GDP to grow 2.1%, materially higher than its projection from December 2023.
We founded Bondsavvy to empower individual investors. A key part of this is educating investors on bond market events and concepts, so individuals can be as well informed as the world's largest investors.
This fixed income blog post covers key takeaways from the March 2024 FOMC press conference and the Federal Reserve Summary of Economic Projections report (the "SEP"):
- The medians of the March 2024 Fed dot plot project the fed funds rate to fall 75 basis points in 2024, 75 basis points in 2025, and 75 basis points in 2026, for a total of 225 basis points (or 2.25 percentage points, as shown in Figure 1).
- Many high quality corporate bonds yield between 5-8%, which can be locked in for 5, 10, or 20+ years. Yields of large money market funds, such as Vanguard VMFXX, vary monthly and would fall as the fed funds rate declines.
- The FOMC has significantly increased its projection for 2024 US GDP growth from 1.4% in December 2023 to 2.1% in March 2024.
- The March 2024 Fed dot plot is slightly more hawkish than the December 2023 dot plot. The median projected yearend 2024 and 2025 fed funds rates were, respectively, 30 and 20 basis points higher in the March 2024 Fed dot plot compared to the December 2023 Fed dot plot.
- The Fed has reduced the size of its securities holdings ("the Fed balance sheet") by $1.5 trillion since reaching a peak of $9 trillion in April 2022
- By yearend 2026, 11 of the 19 FOMC members projected the Fed funds rate range to be between 2.75% to 3.25%. These assumptions are based on inflation stabilizing at 2.0% by 2026.
- We encourage investors to consider the Fed dot plot in the context of the other economic projections contained in the SEP and summarized in Figure 2.
The FOMC Press Conference March 2024
After the FOMC released its 2:00pm Eastern Time statement to hold the fed funds target rate at 5.25-5.50%, Fed Chair Jerome Powell hosted a press conference at 2:30pm Eastern Time. Figure A shows key statements he made during the press conference, which included the FOMC's views on the labor market, inflation, and potential rate cuts.
Figure A: Key Statements from the FOMC Press Conference March 2024
 Image licensed from Getty Images.
One item that received less press coverage was the continued reduction in the Fed's balance sheet, or its "securities holdings." The Fed grew its balance sheet from approximately $4 trillion in February 2020 to $9 trillion in April 2022. On March 11, 2024, the Fed balance sheet had fallen $1.5 trillion to $7.5 trillion. The FOMC is planning further significant reductions per the March 2024 FOMC press conference.
The March 2024 Fed Dot Plot
The 19 FOMC participants include seven members of the Federal Reserve Board of Governors and the presidents of the 12 Federal Reserve Banks. In the Fed dot plot, each dot represents a participant's "judgment of the midpoint for the federal funds rate." Note that, at each FOMC meeting, only 12 of the 19 participants have a vote on setting the fed funds target rate.
What Does the March 2024 Fed Dot Plot Say?
On March 20, 2024, the FOMC left the target fed funds rate unchanged at 5.25% to 5.50%. In Figure 1, we show the March 20, 2024 target fed funds rate in the black rectangle.
As we move toward the end of 2024, the belly of the dot plot is 4.50-4.75%, which would imply a 0.75 percentage-point (or 75 "basis-point" or "75 bps") cut between March 2024 and December 2024. Of course, this projection was held by only 9 of the 18 FOMC participants, and we do not know which of the 19 dots are voting members.
Figure 1: March 2024 Fed Dot Plot
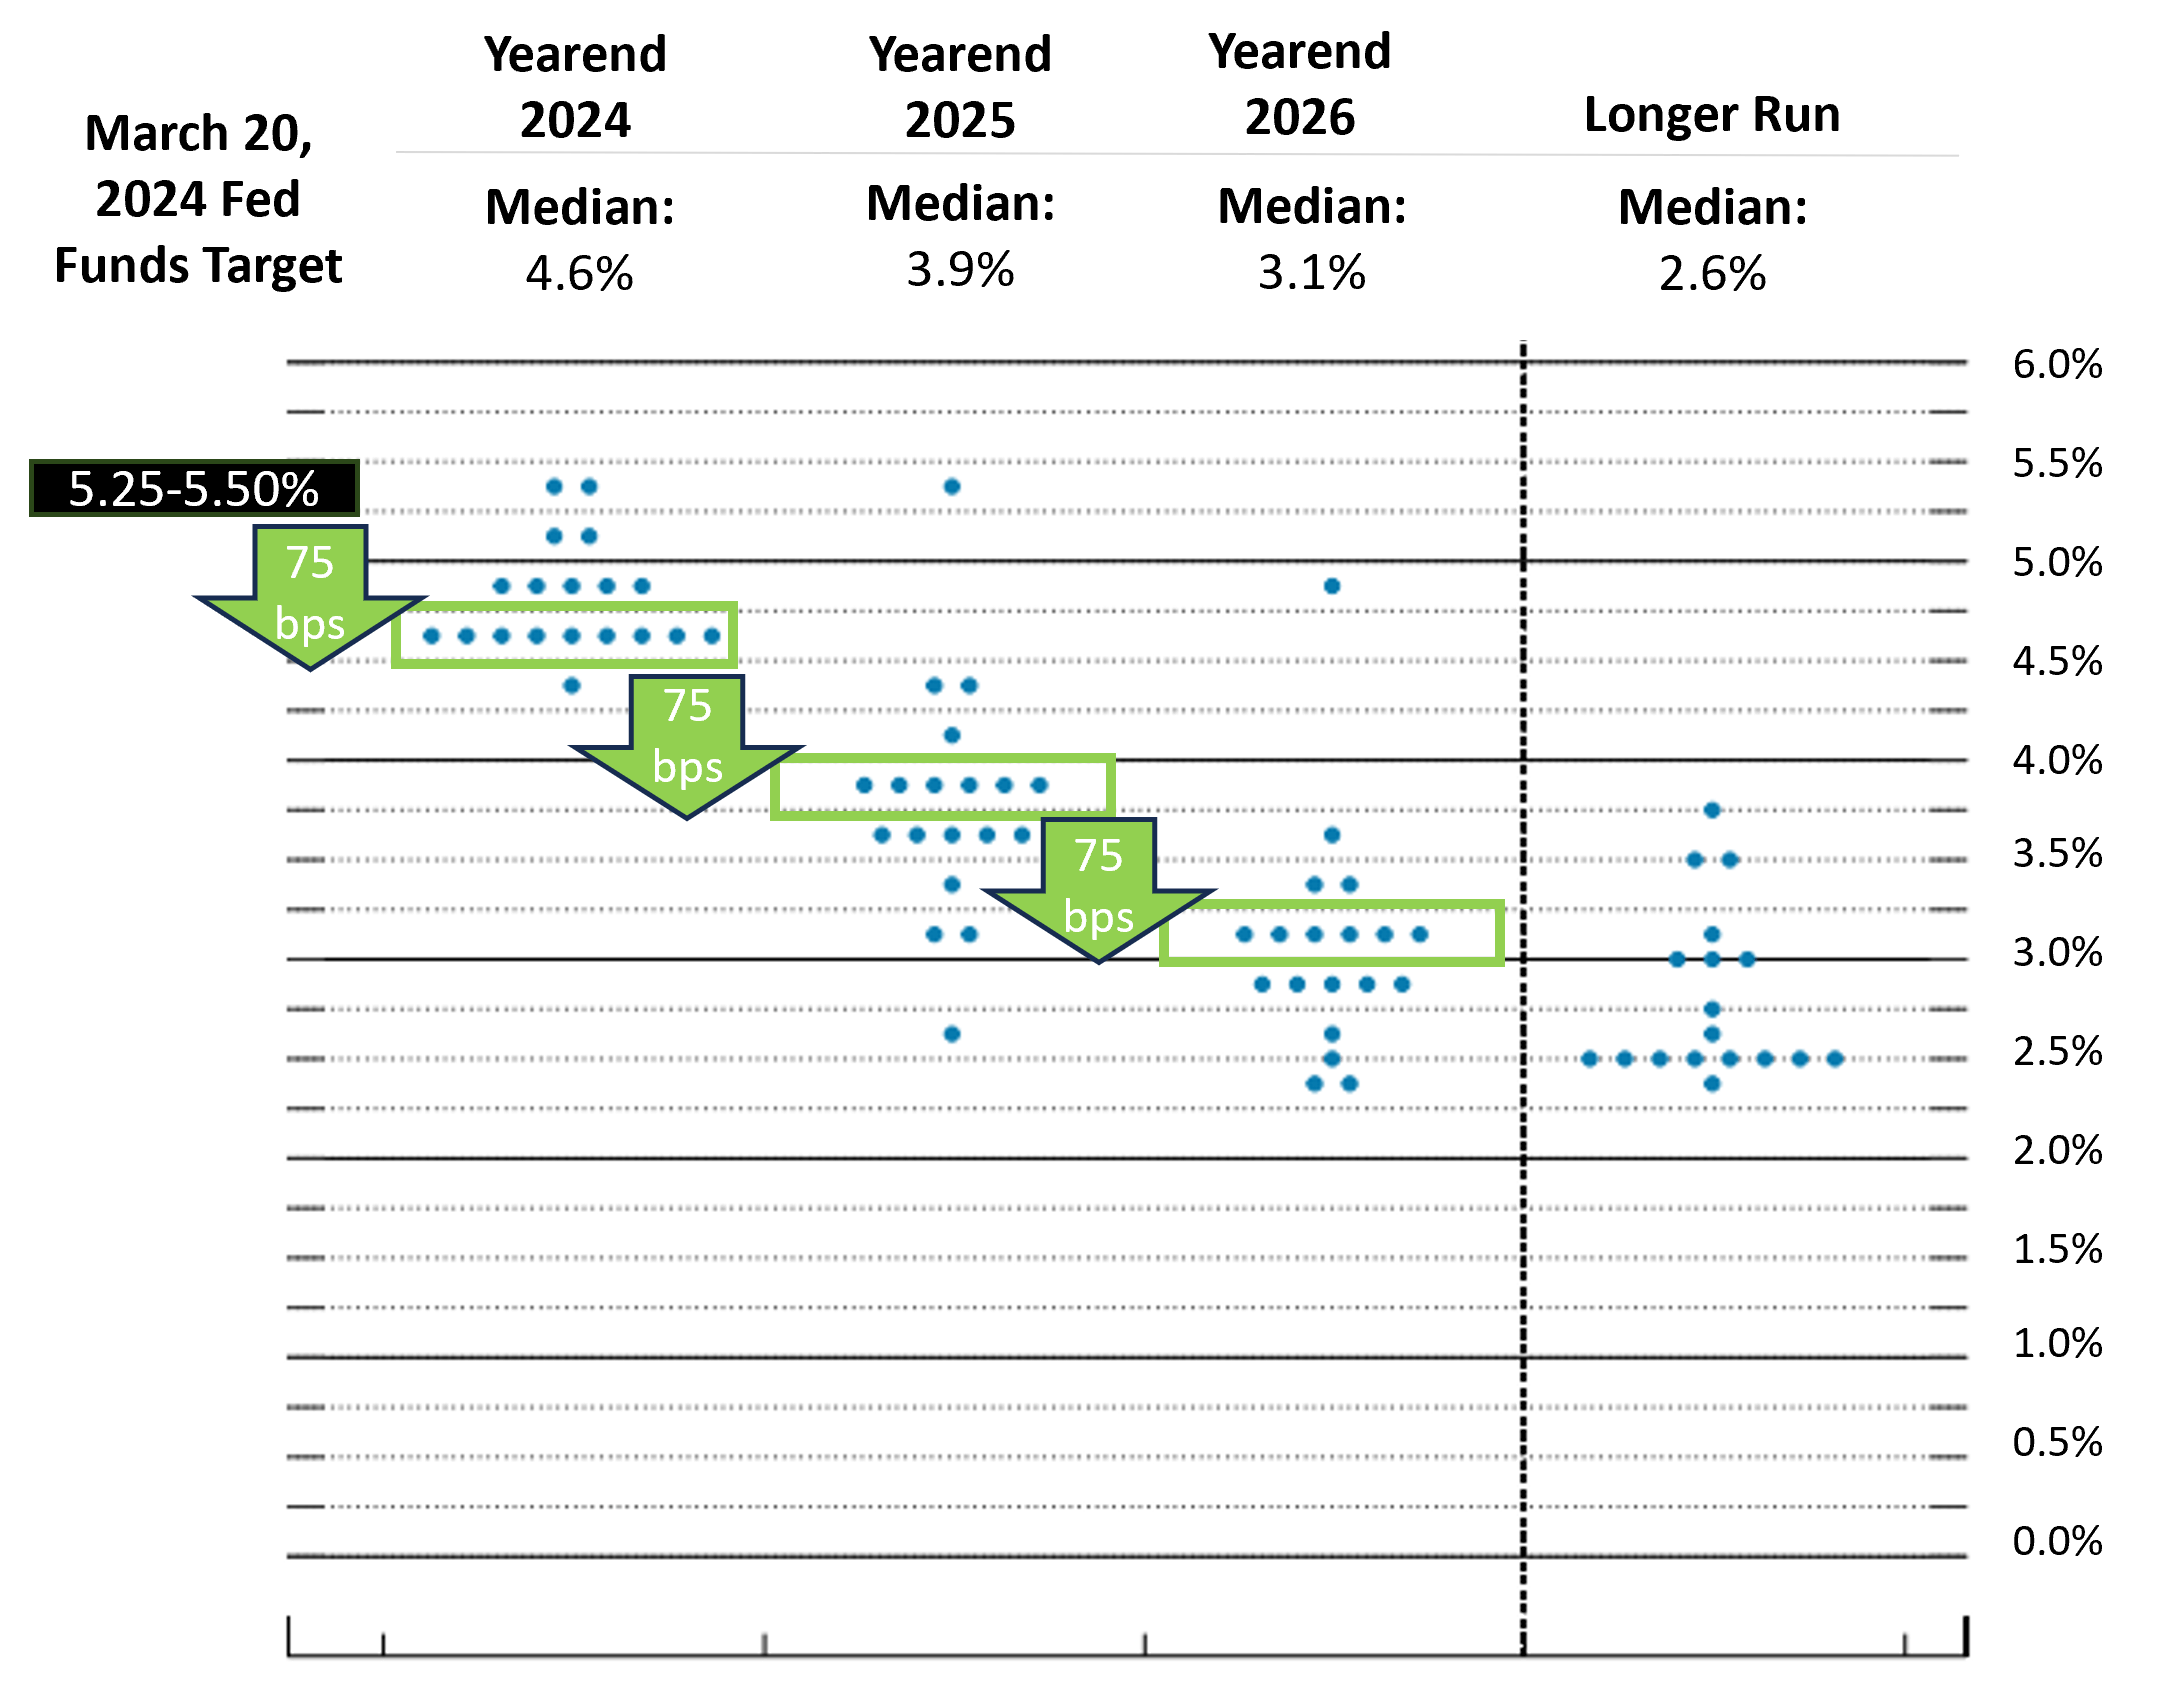
Source: US Federal Reserve Summary of Economic Projections, March 20, 2024
In 2025, the median fed funds rate projection falls to 3.75-4.00%, which implies another 75 basis points worth of cuts in 2025. Please note that this projected target fed funds rate is 25 basis points higher than the projection shown in December 2023 Fed dot plot.
The March 2024 dot plot projects another 75 basis points of rate cuts in 2026, which would reduce the fed funds target rate range to 3.00-3.25%, 25 basis higher than the December 2023 FOMC projections.
Why the Fed Turned More Hawkish in the March 2024 Fed Dot Plot
In addition to containing the Fed dot plot, the SEP report contains FOMC participants' estimates of unemployment, PCE inflation, and GDP growth. Figure 2 shows the FOMC participant economic projections released during the six most recent SEP reports.

Bondsavvy Subscriber Benefit
We founded Bondsavvy to empower individual investors to benefit from the income, growth, and principal protection individual corporate bonds can provide.Get Started
The biggest change between the December 2023 and March 2024 economic projections is the more-bullish views on economic growth FOMC participants currently have. As highlighted in yellow, the FOMC participants increased their median projection for 2024 GDP growth from 1.4% to 2.1%. In addition, as highlighted in orange, FOMC participants believe yearend 2024 PCE inflation of 2.4% will be unchanged compared to where it stood in January 2024.
We believe the sticky inflation coupled with higher-than-expected GDP growth has created more FOMC hawks. While the March 2024 fed funds rate projections were only 25 basis points more hawkish in 2025 and 2026 vs. the December 2023 SEP, these factors did have at least some impact on participants' thinking.
Figure 2: March 2024 Economic Projections of FOMC Participants
| Date of Projection | 2022 | 2023 | 2024 | 2025 | 2026 | Longer Run |
| Unemployment Rate | ||||||
| March 2024 | NA | NA | 4.0% | 4.1% | 4.0% | 4.1% |
| Dec 2023 | NA | 3.8% | 4.1% | 4.1% | 4.1% | 4.1% |
| Sept 2023 | NA | 3.8% | 4.1% | 4.1% | NA | 4.0% |
| June 2023 | NA | 4.1% | 4.5% | 4.5% | NA | 4.0% |
| Dec 2022 | NA | 4.6% | 4.6% | 4.5% | NA | 4.0% |
| Mar 2022 | 3.5% | 3.5% | 3.6% | NA | NA | 4.0% |
| PCE Inflation | ||||||
| March 2024 | NA | NA | 2.4% | 2.1% | 2.0% | 2.0% |
| Dec 2023 | NA | 2.8% | 2.4% | 2.1% | 2.0% | 2.0% |
| Sept 2023 | NA | 3.3% | 2.5% | 2.2% | NA | 2.0% |
| June 2023 | NA | 3.2% | 2.5% | 2.1% | NA | 2.0% |
| Dec 2022 | NA | 3.1% | 2.5% | 2.1% | NA | 2.0% |
| Mar 2022 | 4.3% | 2.7% | 2.3% | NA | NA | 2.0% |
| Change in Real GDP | ||||||
| March 2024 | NA | NA | 2.1% | 2.0% | 2.0% | 1.8% |
| Dec 2023 | NA | 2.6% | 1.4% | 1.8% | 1.9% | 1.8% |
| Sept 2023 | NA | 2.1% | 1.5% | 1.8% | NA | 1.8% |
| June 2023 | NA | 1.0% | 1.1% | 1.8% |
NA | 1.8% |
| Dec 2022 | NA | 0.5% | 1.6% | 1.8% | NA | 1.8% |
| Mar 2022 | 2.8% | 2.2% | 2.0% | NA | NA | 1.8% |
Source: FOMC Summary of Economic Projections Reports
The December 2023 Fed Dot Plot
On December 13, 2023, the FOMC left the target fed funds rate unchanged at 5.25% to 5.50%. Upon the FOMC making this decision, all of the dots in 2023 column appeared at the same 5.25-5.50% range, as shown in Figure 3.
As we move toward the end of 2024, the belly of the dot plot is 4.50-4.75%, which would imply a 0.75 percentage-point (or 75 "basis-point" or "75 bps") cut between December 2023 and December 2024. In 2025, the median fed funds rate projection fell to 3.50-3.75%, which implied another 100 basis points worth of cuts in 2025. This is followed by another 75 basis points of cuts in 2026, which would reduce the fed funds target rate range to 2.75-3.00%.
In Figure 3 we box in green the median for each year's projection.
Figure 3: December 2023 Fed Dot Plot of the Projected Year-End Fed Funds Rate
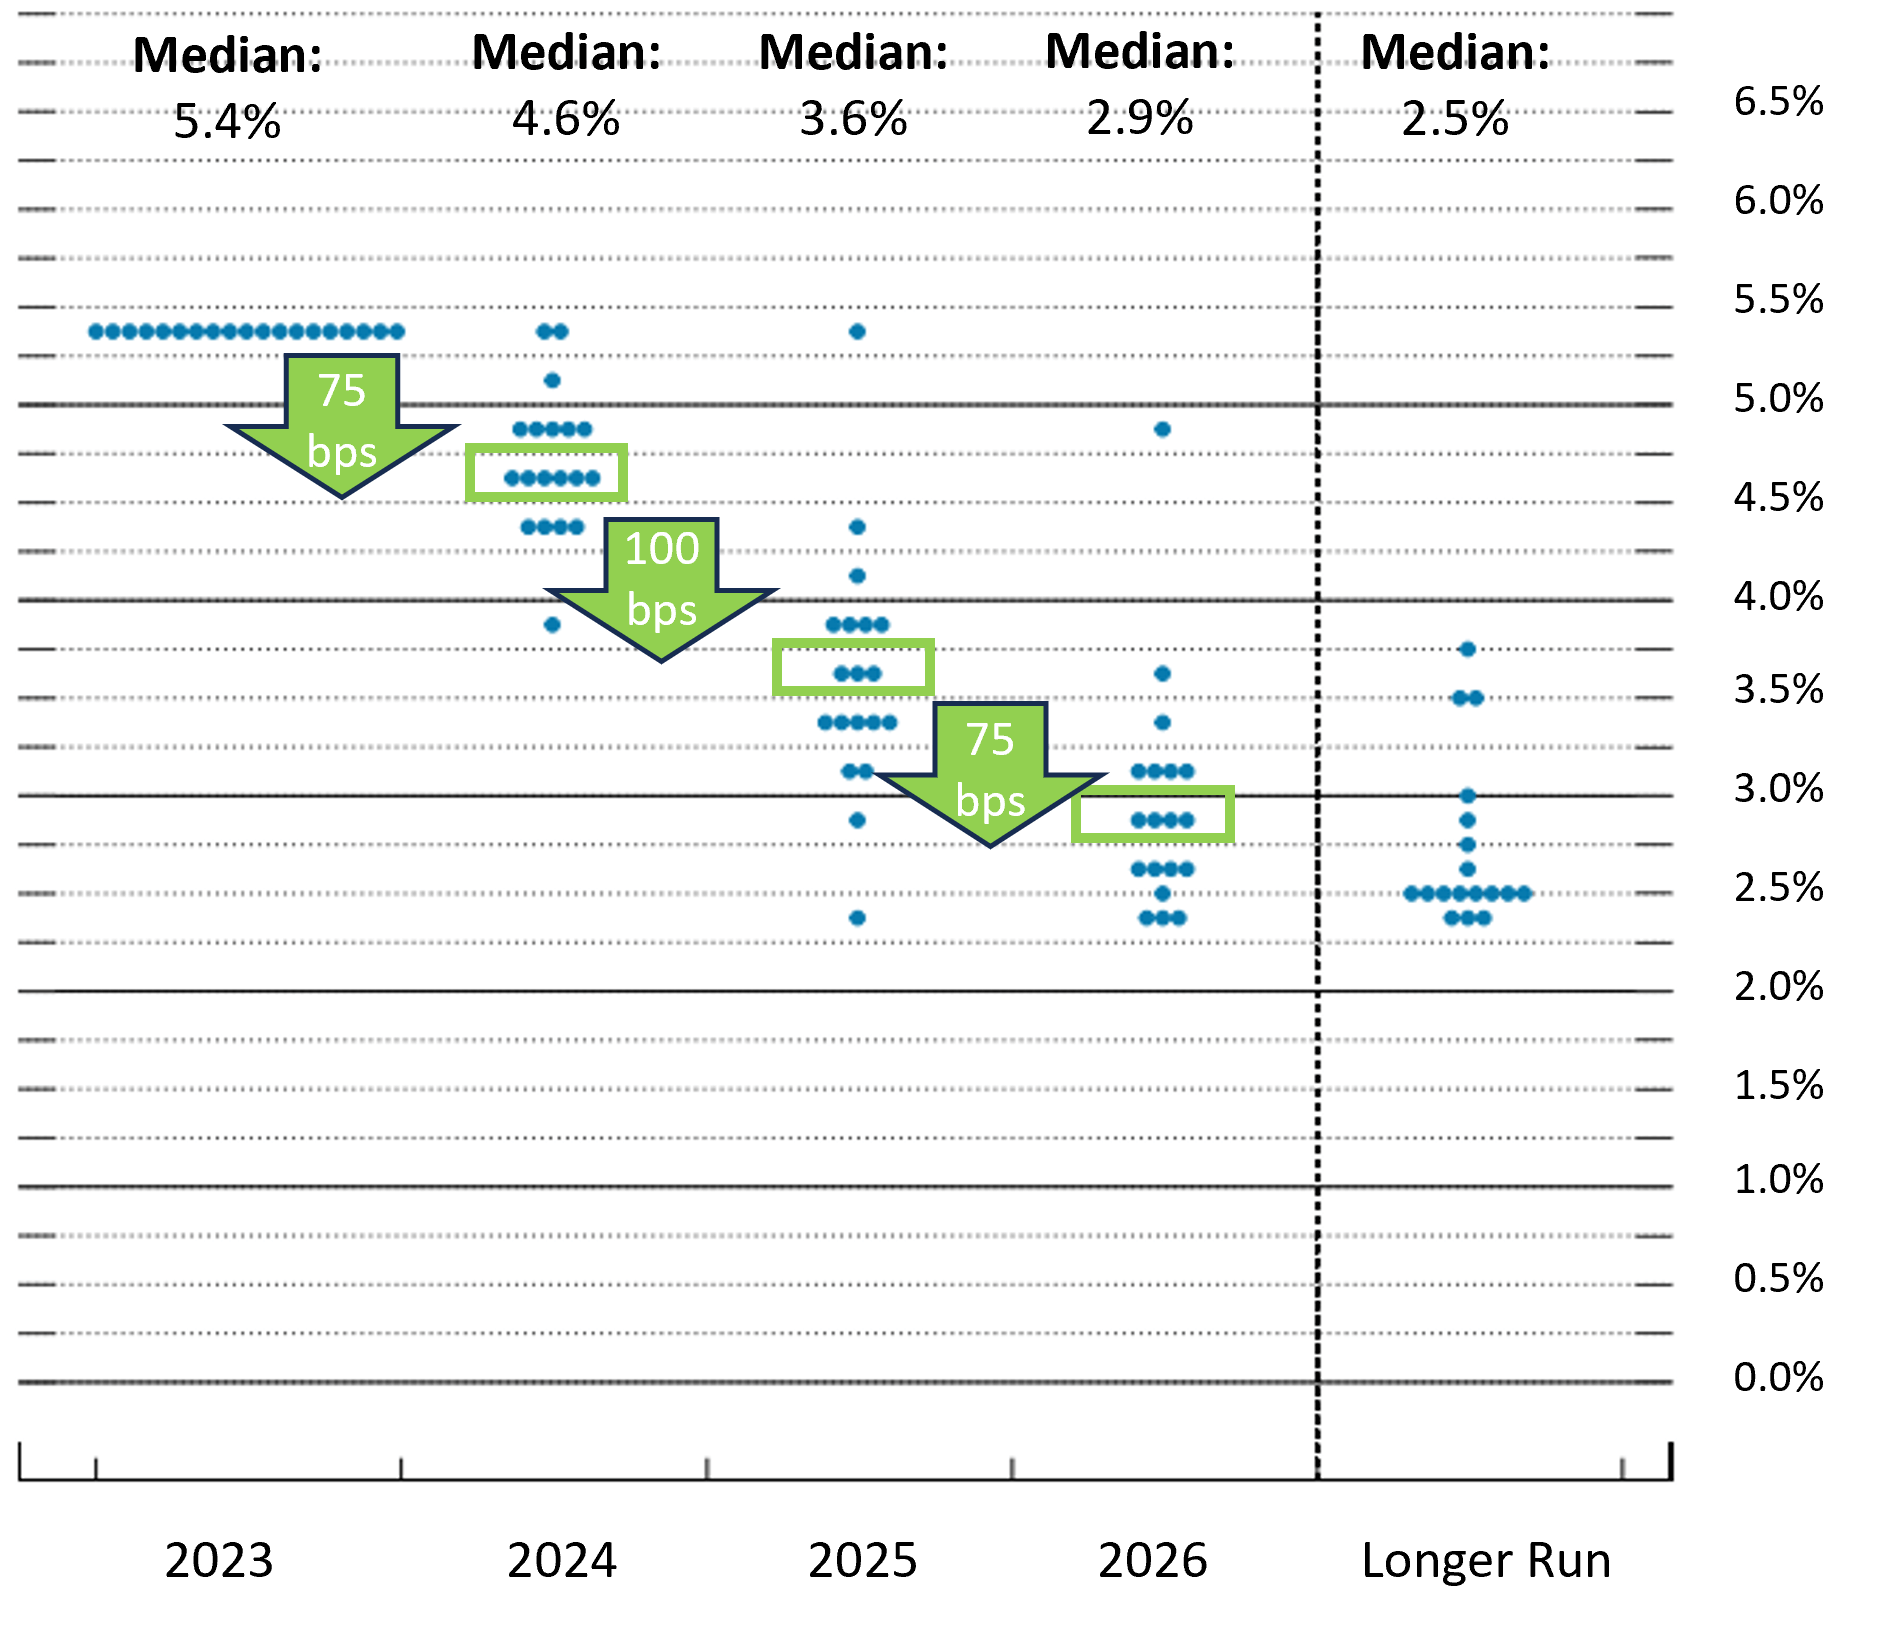
Source: US Federal Reserve Summary of Economic Projections, December 13, 2023
What the Fed Dot Plot Means for Investors
PCE inflation hit a post-pandemic peak of 6.8% in June 2022 and fell to 2.4% in January 2024. While this fall is significant, the Fed will not rest until inflation reaches 2.0% for a sustained period. We encourage any doubters to watch Chair Powell's post-FOMC-meeting pressers, which have reiterated this point ad nauseam.
As we have seen, the Fed dot plot is not perfect at predicting the future fed funds rate. That said, what we find most useful is the view of FOMC participants on the appropriate level of interest rates across different economic assumptions.
Across all Fed dot plots shown in this fixed income blog post, the longer-run projections have been 2.0% inflation and a fed funds rate of approximately 2.50%. This longer-run fed funds rate is three percentage points below the upper end of the current 5.25-5.50% fed funds target range.
Given the stickiness of inflation and the Fed's recent hawkish stance, short-term interest rates might remain above 4.5% through 2024, which could keep money market fund returns elevated. The question investors must ask themselves, however, is how to position themselves beyond 2024.
As we discuss in our Eight Reasons Not To Own Vanguard VMFXX blog post, the VMFXX yield is highly correlated to the fed funds rate. As the fed funds rate falls, we would expect the VMFXX yield to fall as well. In addition, since money market funds such as Vanguard VMFXX cannot achieve capital appreciation, such investments would not benefit from an increase in bond prices associated with falling interest rates.
In our VMFXX yield blog post, we discuss how US Treasurys and high quality US corporate bonds have advantages to Vanguard VMFXX, including higher potential returns, lower fees, and higher credit quality. While a 10- or 20-year corporate bond and a money market fund are different investments, investors may want to consider adding to their corporate bond exposure to take advantage of falling interest rates when they occur. These investments allow investors to lock in interest rates for a longer period than money market funds and to benefit from capital appreciation opportunities in the event interest rates fall.
Differences Between the December 2023 Fed Dot Plot and the September 2023 Fed Dot Plot
In the December 2023 Fed dot plot, 16 of the 19 dots showed an ending 2024 fed fund target rate below 5.00%. This was a much different story in the September 2023 Fed dot plot (Figure 4), where 10 dots were above 5% and 9 dots were below 5%. The September 2023 Fed dot plot even included one true hawk, who indicated a 6.00-6.25% fed funds target rate range at year-end 2024.
Importantly, the December 2023 Fed dot plot provides a much tighter fed funds rate target range for 2025, with 14 of 19 dots appearing between 3.00-4.00%. This is a far cry from the September 2023 fed dot plot, where 2025 fed funds target estimates were from 2.50-5.75%, as shown in Figure 4.
Please note that the Fed dot plot is updated quarterly, and these projections can and will change based on where FOMC participants believe they are in accomplishing the Fed's dual mandate of price stability and full employment.
Previous Fed Dot Plots
The September 2023 Fed Dot Plot
When the Fed left interest rates unchanged on September 20, 2023, the target range for the fed funds rate was 5.25%-5.50%. As shown in Figure 4, 12 FOMC participants believed the target rate should be 5.50%-5.75% at year-end (a 25-basis-point hike), while seven believed the rate should hold steady at existing levels.
Views of FOMC participants diverged more in 2024 and 2025. In 2025, the range of target rates was 2.50%-4.25%, on
the low end, to 4.50%-5.75%, on the high end. The median 2025 fed funds rate projection was 3.9%, a 1.7-point fall from
the 5.6% median fed funds target rate for year-end 2023.
Figure 4: September 2023 Fed Dot Plot of the Projected Year-End Fed Funds Rate
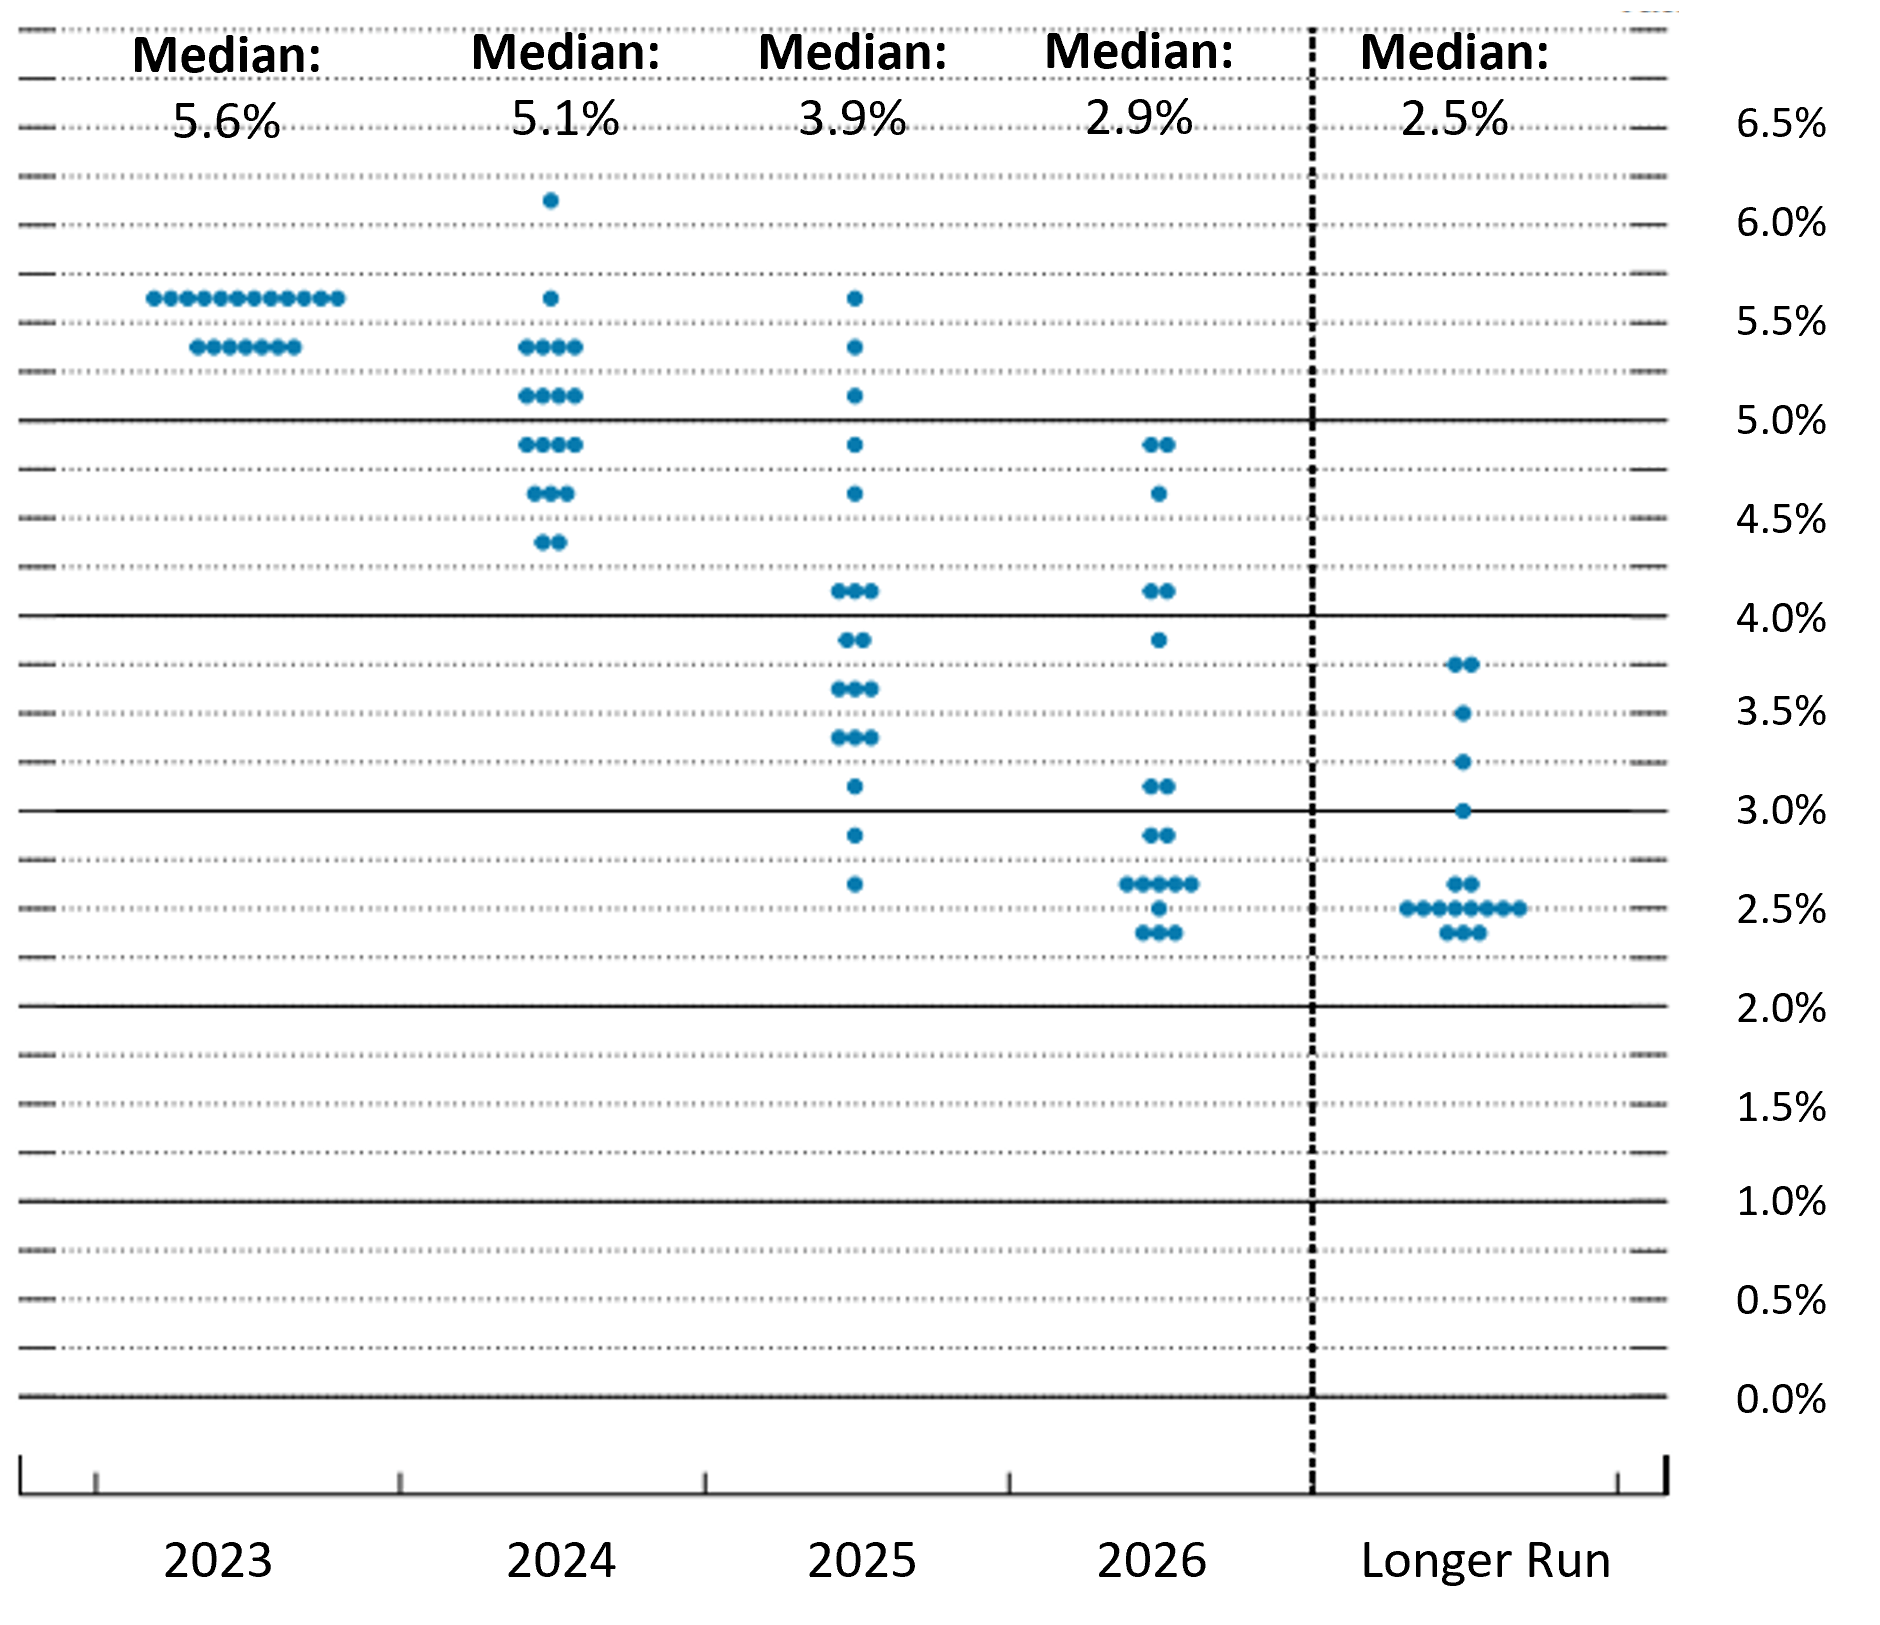
Source: FOMC September 2023 Summary of Economic Projections
In 2026, there was a noticeable split between the hawkish and dovish wings of the FOMC. In this year, six participants believed a range of 3.75-5.00% would be appropriate, whereas 13 participants believed the target rate should be between 2.25%-3.25%.
Bondsavvy Subscriber Benefit
Corporate bonds enable investors to lock in today's high interest rates for long time periods, a compelling alternative to money market funds.Get Started
December 2022 PCE inflation came in at 5.0% compared to the FOMC's 4.3% median projection. While the 2.7% PCE inflation the Fed projected for year-end 2023 in March 2022 is within earshot of the 3.3% projection made September 2023, the Fed's miscalculation was the level of interest rates required to bring PCE inflation to that level.
As shown in Figure 5, in the March 2022 Fed dot plot, the median projection for the fed funds rate was 2.8% at year-end 2023 and 2024 vs. the 5.4% and 4.6% median fed funds rate projections made in the December 2023 Fed dot plot:
Figure 5: March 2022 Fed Dot Plot of the Projected Fed Funds Rate
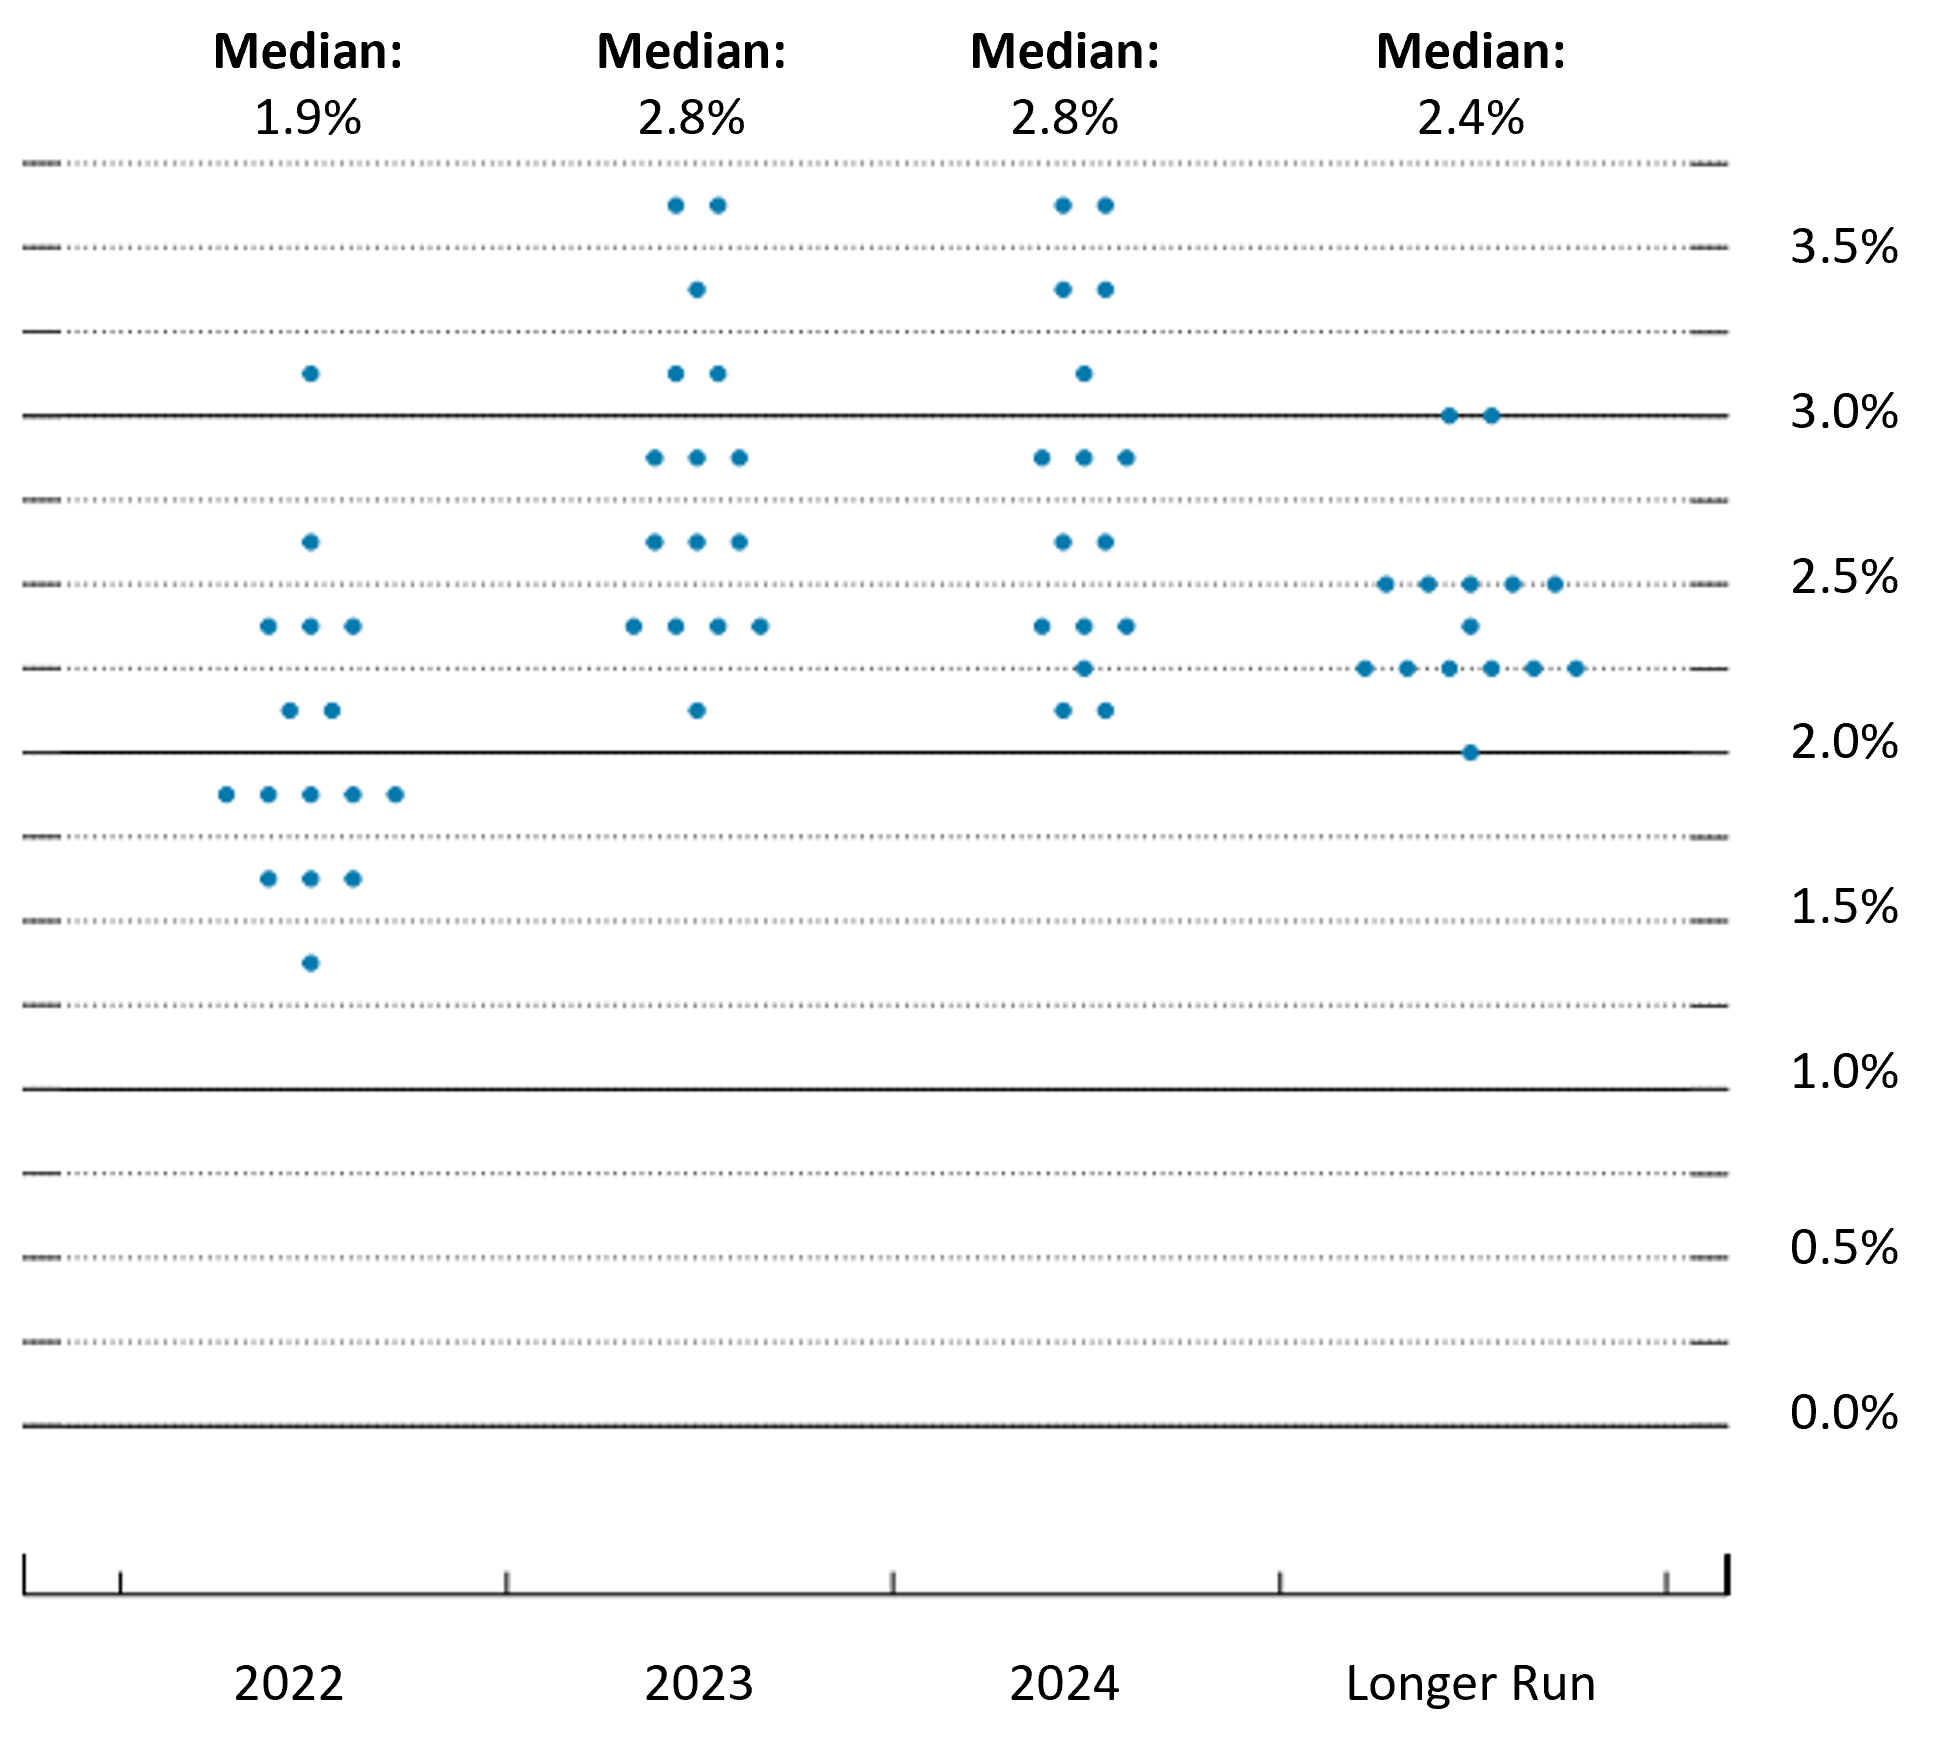
Source: FOMC March 2022 Summary of Economic Projections