What if you knew how to spot a recession before it got here? While each recession is different, they often follow similar patterns, which can help investors prepare their investment portfolios for what could be coming.
Bondsavvy Economic Advisor Article Preview
We just published a new Bondsavvy Economic Advisor article that studies the three most recent US recessions to understand their impact on each segment of the US economy and how this could affect investment decisions in future recessions. This blog post provides a preview of this Economic Advisor article.
Please note that Bondsavvy Economic Advisor is separate from our corporate bond investment recommendation service, which we launched in 2017.
You will learn the following by subscribing to our Economic Advisor newsletter and reading the full 16-page article:
- The makeup of the US economy across its 26-largest segments
- How the last three US recessions impacted each segment of the US economy, including which areas were resilient and which were not
- The part of the US economy that contracted in each of the last three recessions
- What this analysis means for investors
Following is the first three pages of "The Last Three US Recessions: What We Learned" article.
We wrote this Bondsavvy Economic Advisor article to explore any patterns among the three most recent US recessions. Knowing this can empower investors to identify future recessions and how best to weather them. Key observations from the three most recent US recessions are:
- While the Great Recession was the longest recent recession, the Covid-19 recession of 2020 was the most severe, with a total real GDP loss of $1.95 trillion vs. $414 billion for the Great Recession.
- Significant declines in gross domestic private investment occurred in each of the three most recent recessions and were the largest drivers of the 2001 recessions and the Great Recession.
- Services personal consumption, which accounts for nearly half of US GDP, only fell (in the aggregate) in the Covid-19 recession, where it drove $1.3 trillion of that recession's $1.95 trillion decline in real GDP.
- Recessions don't have to be severe to have major impacts on investing. The 1990-91 and 2001 recessions were much shallower than The Great Recession and Covid-19 recession yet high yield bond default rates exceeded 10% shortly after both of these earlier recessions.
- Federal government spending and investment rose in all three recent recessions, while state & local government spending fell in two of the last three recessions.
- While exports fell in each recession, these declines were accompanied by significant declines in US imports. In The Great Recession and Covid-19 recessions, the decline in imports exceeded that of exports. Since GDP reflects a change in net exports, the greater decline in imports actually caused net exports to rise, a boost to US GDP.
 Join Bondsavvy Economic Advisor
Frequency and Length of Most Recent US Recessions
There were 12 recessions between 1948 and early 2025 (77 years). During this time, the two longest recessions were the 2007-2009 Great Recession (1 year and 6 months) and the 1981-1982 recession (1 year and 4 months).
The longest periods of time between 1948-2025 recessions were i) 10 years and 8 months preceding the Covid-19 recession of early 2020 ii) and 10 years before the 2001 (dot-com) recession. The shortest time period between recessions was one year, between the 1980 and 1981-82 recessions.
Figure 1 provides the timing and select metrics for the last three US recessions. We will then dig into the key components of US GDP to show investors how each performed during the recent recessions.
Figure 1: Summary of the Three Most Recent US Recessions
| Recession Title | Time Period | Length | Peak
Unemployment | Biggest Quarterly
Drop in Real GDP
|
|---|
| Covid-19 | Feb to April 2020 | 2 months | 14.8% (April '20) | -31.4% (Q2 '20) |
| Great Recession | Dec 2007 to June 2009 | 1 year, 6 months | 10.0% (Oct '09) | -6.4% (Q1 '09) |
| Dot-com Bubble Burst | March to November 2001 | 8 months | 6.3% (Jun '03) | -1.3% (Q3 '01) |
Sources: US Bureau of Labor Statistics. US Bureau of Economic Analysis.
Severity of Recent US Recessions
Not all recessions are created equal, and we can see this clearly in Figure 2, which shows the quarterly US GDP percentage and dollar declines during the last three US recessions. It also aggregates the quarterly dollar declines to show the cumulative impact of each recession on US GDP.
As shown, the 2001 recession was mild, with a modest $24 billion decline in real GDP across Q2 and Q3 2001. While it was the longest most-recent recession, the Great Recession's $414 billion cumulative GDP decline paled in comparison to the $1.95 trillion decline from the Covid-19 recession in 2020.
Later in this section, we will show how key economic metrics such as unemployment and household debt service payments reacted in the wake of previous US recessions.
Figure 2: Real GDP Decreases of Last Three US Recessions
$ in billions
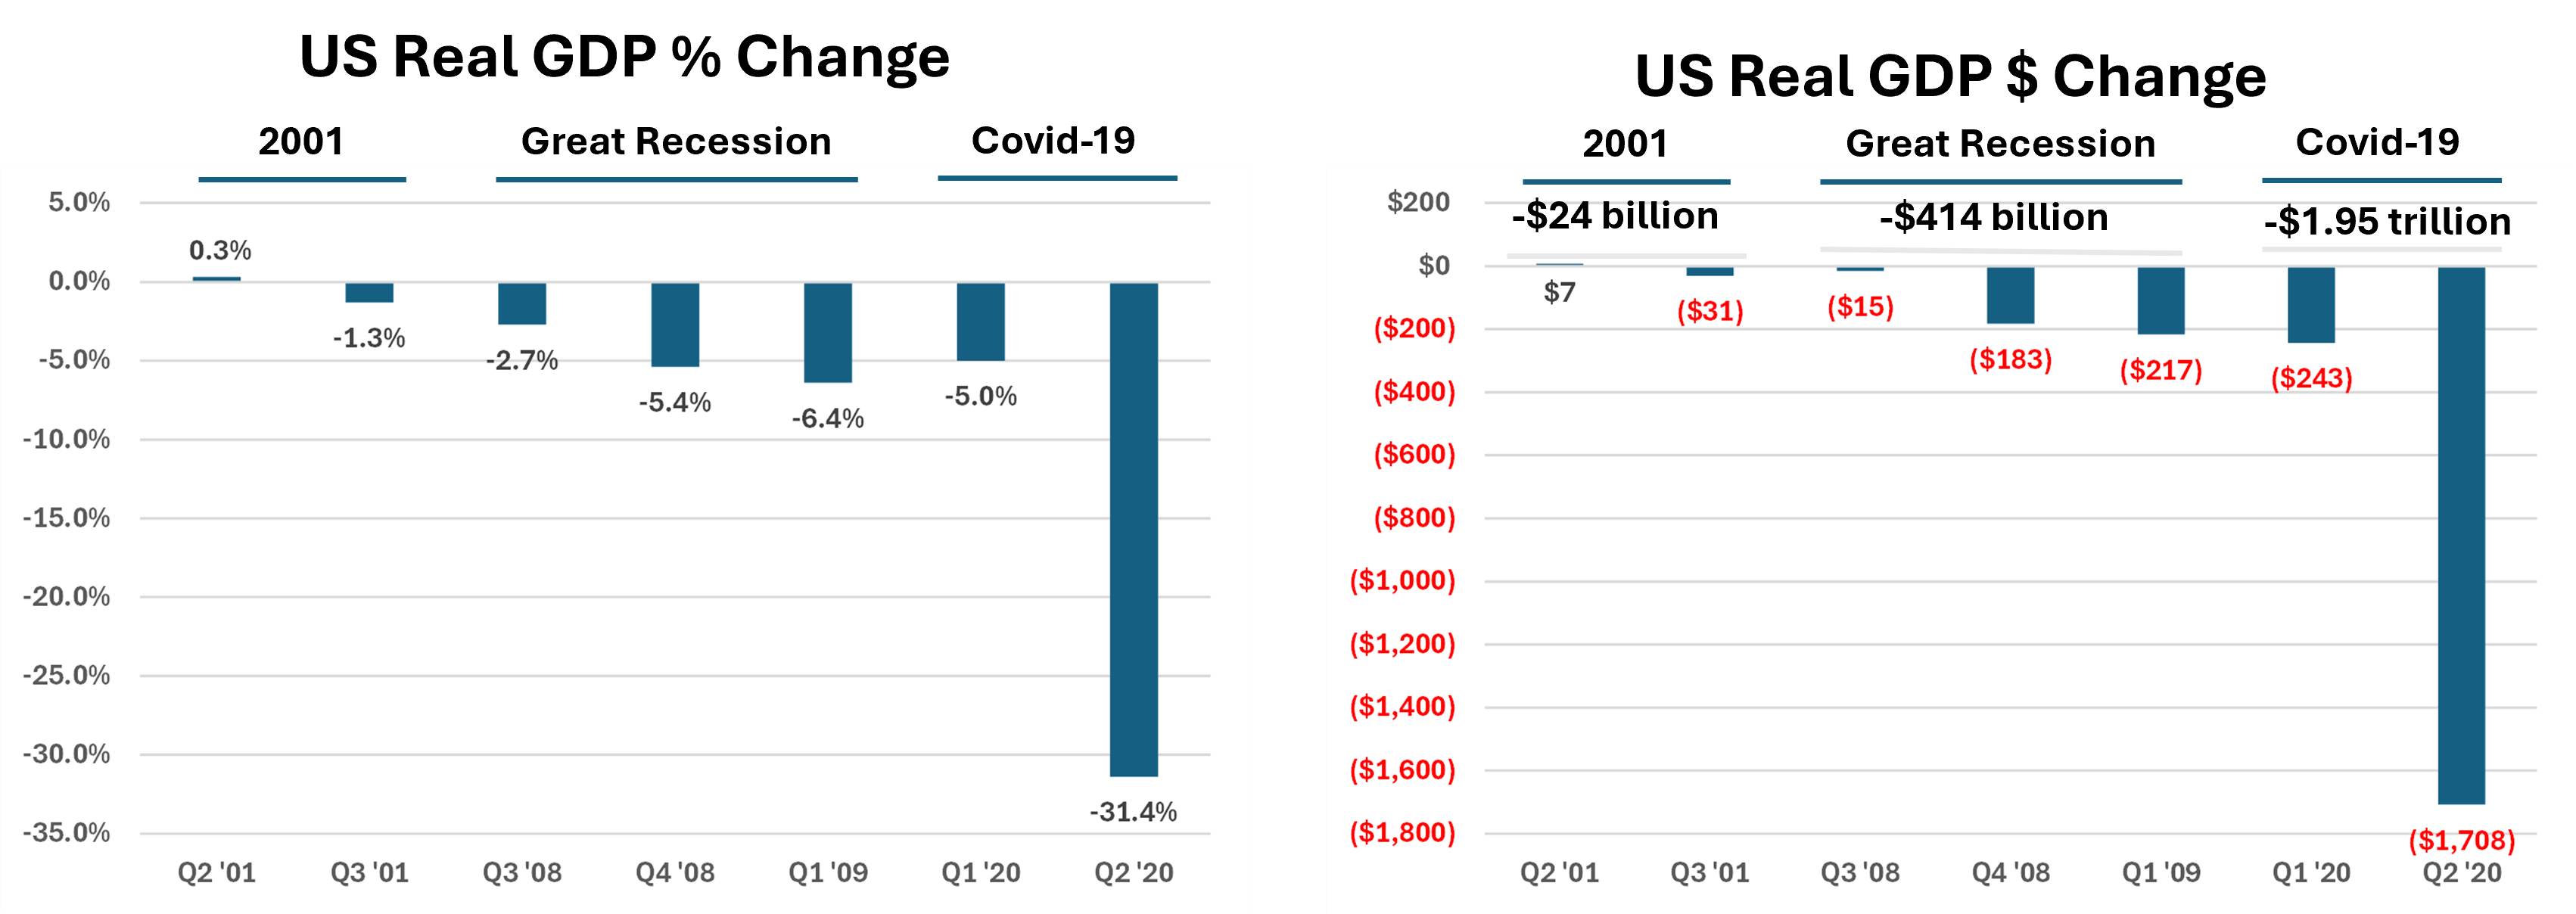
Source: Raw data are from the US Bureau of Economic Analysis.
While The Great Recession did not have the massive GDP declines of the Covid-19 recessions, it was first time since the Great Depression that US GDP contracted more than five percent for two consecutive quarters.
Key Economic Indicators Over Recent Expansions and Contractions
As noted earlier, there have been 12 US recessions over the 77 years between 1948 and 2025. Each US recession is shaded in gray in Figure 3. As expected, unemployment rose during each recession, with the highest peak, 14.8%, occurring in the wake of Covid-19.
Historical Changes to US Unemployment Rate
In most cases, the end of the recession also marked the peak unemployment rate; however, in the 1991-92 and 2001 recessions, unemployment peaked well after the recession ended. The 2001 US recession ended November 2001, but it took another 19 months for unemployment to reach its June 2003 peak of 6.3%
Figure 3: United States Unemployment Rate. 1948 to February 2025
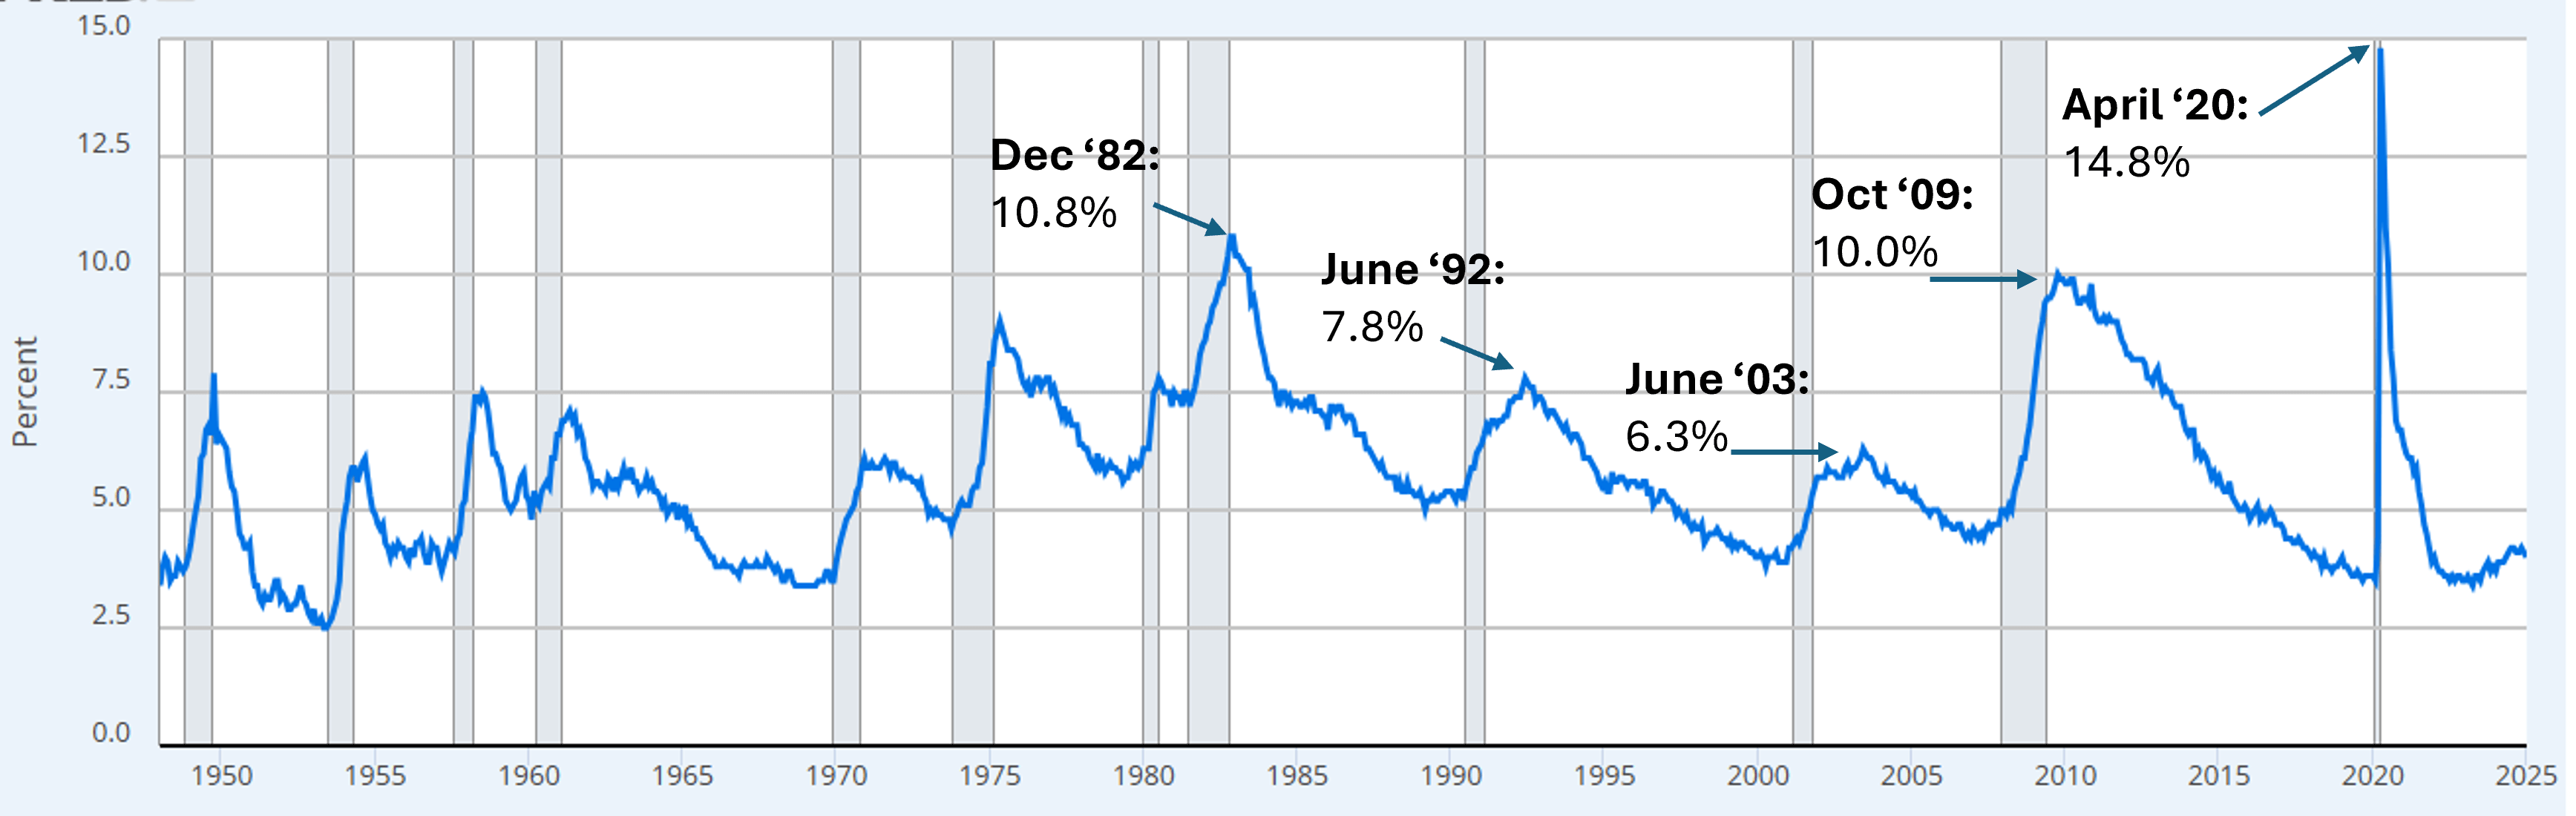
Source: US Bureau of Labor Statistics via FRED.
In looking deeper at Figure 3, there are two notable trends, which have been moving in opposite directions. On the positive side, the unemployment rate troughs have generally been moving lower over the last 45 years. In May 1979, the unemployment rate trough fell to 5.6%. The trough unemployment rate has generally inched lower over the last five expansionary periods and hovered around 3.5% for much of 2023. Of course, the labor force participation rate has also been falling, but that topic will be for another Bondsavvy Economic Advisor article.
On the flip side, the peak unemployment rate has also been increasing since the 2001 recession, reaching a 77-year high of 14.8% in April 2020.
Household Debt Service Payments as Percentage of Disposable Income
For Bondsavvy's investment recommendation service, we review key economic trends before we make new bond recommendations. Given personal consumption expenditures account for nearly 70% of the US economy, we always need to assess the health of the US consumer.
Figure 4 shows US household debt service payments as a percentage of disposable income. We believe this is an important gauge of the health of the US consumer, and it was a telltale sign for the 2001 recession and The Great Recession. This metric did not signal the Covid-19 recession, as the US consumer was in decent shape leading up to March 2020, with the household debt service metric below 12%. It was the onset of the pandemic and business and healthcare shutdowns that caused GDP to fall so quickly.
Figure 4: United States Household Debt Service Payments as Percentage of Disposable Income: Q1 1980 to Q3 2024
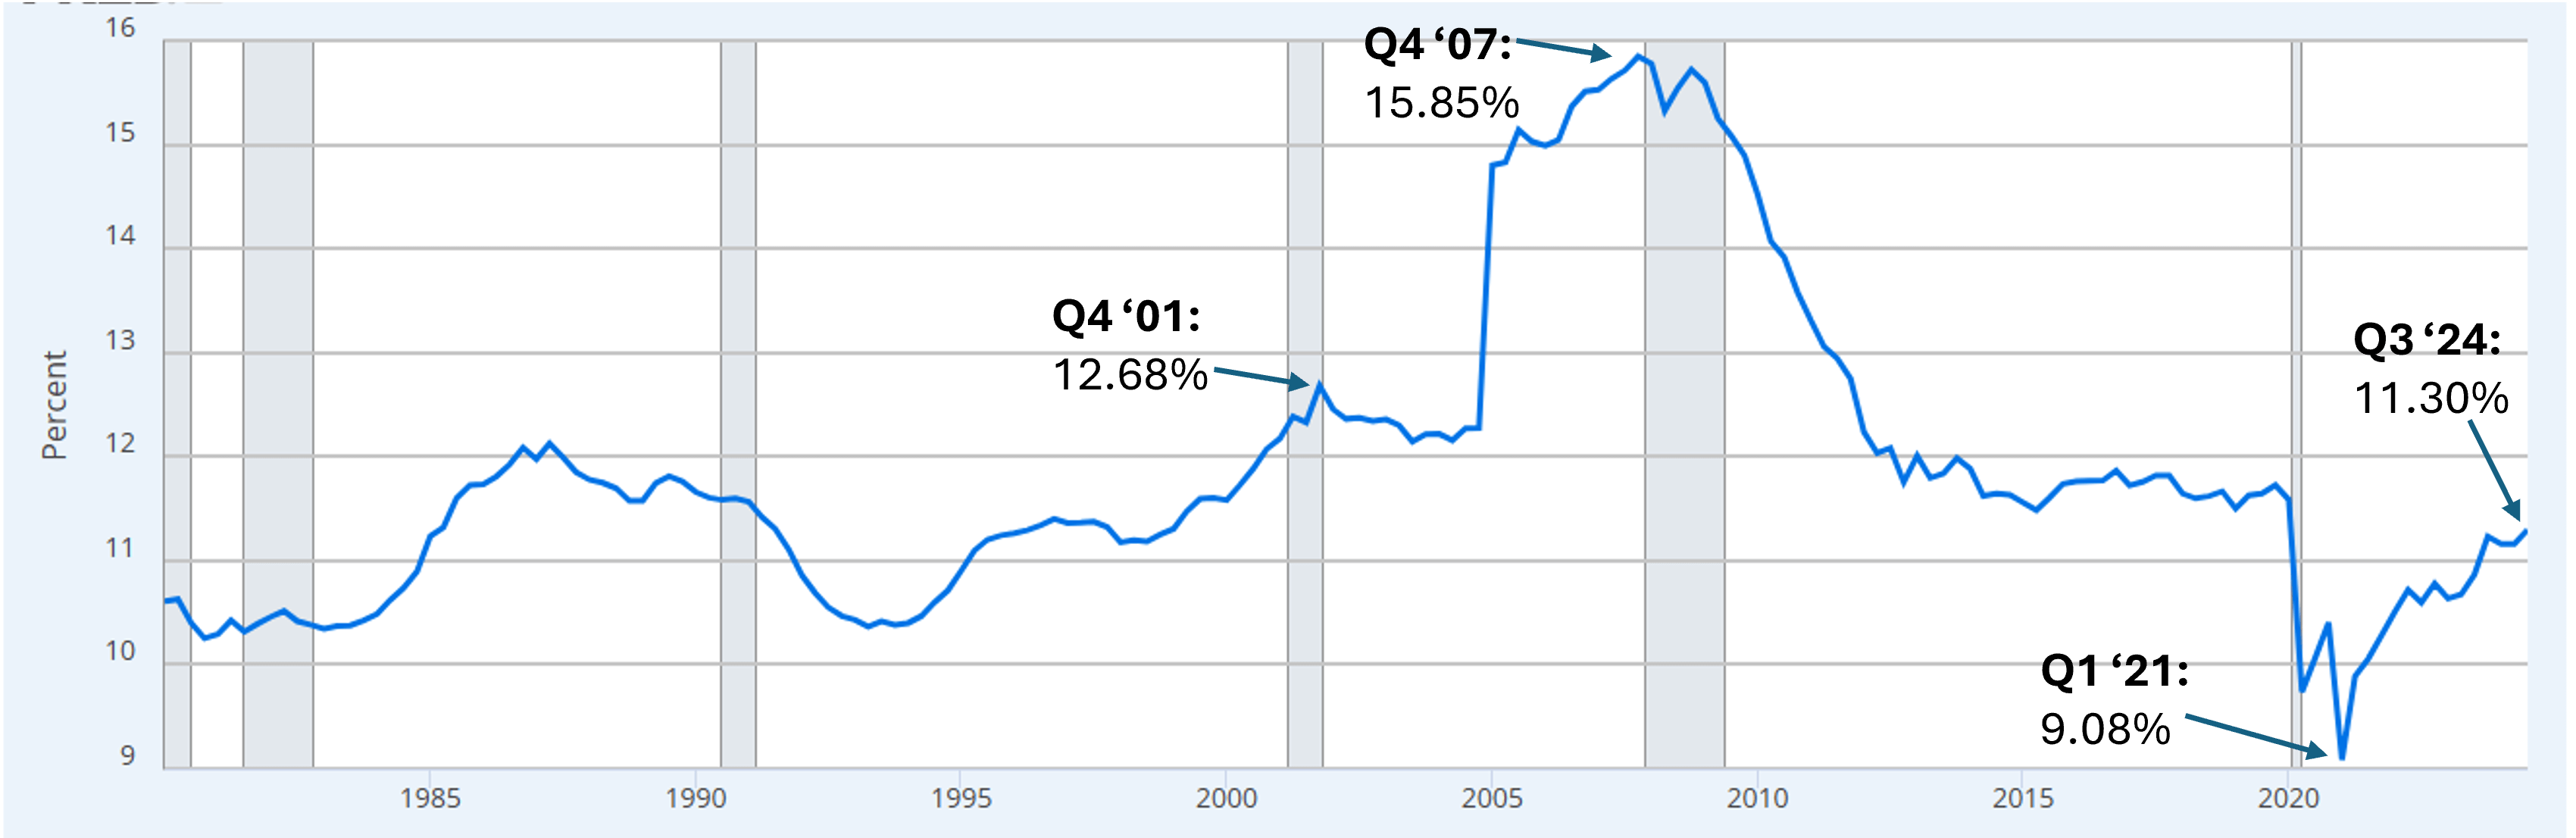
Source: Board of Governors of the US Federal Reserve System.
Breaking Down US GDP
Some people (including many appearing in the media) say, with high conviction, "well, there's going to be a recession within 6 to 12 months." But, what does that mean in the real world? Are certain parts of the economy mostly unchanged while a few fall drastically, or is it something else?
To evaluate the drivers of recent US recessions, we must first understand the components of US GDP. We all remember from Macroeconomics 101 that GDP is consumption plus fixed investment plus government spending plus net exports, but that's analysis at the 40,000 foot level. We need to dig deeper to understand how different segments of the economy have performed in recent US recessions.
Subscribe to Bondsavvy Economic Advisor to read the rest of this 16-page article. Click the button below to read previews of our other articles and to join:
Join Bondsavvy Economic Advisor