On March 18, 2026, the US Federal Reserve projected to reduce the target range of the fed funds rate an additional half point by yearend 2027. After keeping the fed funds rate unchanged today, the target range would fall from 3.50%-3.75% to 3.00%-3.25% by yearend 2027, according to the March 2026 Fed dot plot. This is the same level of rate cuts projected by the previous Fed dot plot.
As money market yields move in lockstep with the fed funds rate, we expect the Vanguard VMFXX 7 day yield to fall to near-3% by yearend 2027 should the Fed make its projected rate cuts. By comparison, the median YTM for the 27 most recently recommended corporate bonds for our Bondsavvy Premier service was 5.85% on March 13. Our active bond investment strategy seeks to achieve corporate bond returns that exceed a bond's purchase date YTM.
Of note on the March 2026 Fed dot plot is an increasing level of consensus related to 2026 Fed rate cuts. While only 12 people vote on the Federal Open Market Committee (FOMC), 19 people provide the fed funds rate projections that make up the Fed dot plot.
For the March 2026 Fed dot plot, seven members saw no 2026 rate cuts and seven saw one rate cut. Two projected 50 basis points, another two projected 75 basis points, and one projected 100 basis points of 2026 Fed rate cuts.
Fed governor Stephen Miran was the only voting FOMC member to vote against leaving the fed funds rate unchanged today, preferring for there to be, instead, a quarter-point rate cut.
Key takeaways from today's FOMC meeting and Summary of Economic Projections (the "SEP") release included:
- The median of the March 2026 Fed dot plot projections sees the fed funds rate falling 25 basis points in 2026 and 25 basis points in 2027, as shown in Figure 1.
- The Fed projects inflation to remain elevated, with PCE inflation expected to end 2026 at 2.7%, 30 basis points higher than the December 2025 projection. It expects PCE inflation of 2.2% by yearend 2027.
- Meeting participants raised 2026 real GDP growth projections by 10 basis points to 2.4%; however, this was impacted by growth being taken from Q4 2025 and put into Q1 2026 due to the government shutdown and reopening.
- As of March 11, 2026, the Fed had reduced the size of its securities holdings ("the Fed balance sheet") by $2.4 trillion, to $6.65 trillion, since reaching a peak of $9 trillion in April 2022. This is an increase of $107 billion compared to December 10, 2025.
- At 5:00pm EDT on March 18, the 10-year and 30-year US Treasury yields were 4.27% and 4.88%, respectively, according to Tradeweb data. These yields were 5 and 3 basis points higher, respectively, from where they closed March 17.
Money market fund returns closely mirror the fed funds rate. If the fed funds rate follows the projected path to low-3.00% by 2027, investors in the Vanguard VMFXX money market fund should expect their returns to follow suit.
The Bondsavvy Premier service has added 27 new recommended corporate bonds since November 2024, with pick date yields to maturity ranging from 4.72% to over 9.00%. Yields of large money market funds, such as Vanguard VMFXX, vary monthly and will fall as the fed funds rate declines. Bond fund distributions also vary monthly and cannot be relied upon to deliver income the way fixed-rate individual corporate bonds can.

Bondsavvy Subscriber Benefit
Moody's and S&P bond ratings do not assess whether a bond is a good value and, therefore, can have limited use for investors. Bondsavvy identifies corporate bonds that pay high coupons relative to their risk and offer capital appreciation opportunities.
Get Started
The March 2026 Fed Dot Plot
The Fed dot plot shows the projected yearend target range for the fed funds rate from each of the 19 FOMC meeting
participants. Each dot represents the opinion of one FOMC participant.
As shown in Figure 1, more consensus appears to be developing on the extent of 2026 Fed rate cuts, with 14 of 19 meeting participants projecting either no or only one rate cut. Of note, recently appointed Stephen Miran, a fervent interest-rate cutter, appears to have increased his yearend 2026 fed funds rate target by 50 basis points since his December 2025 dot plot submission.
Figure 1: March 2026 Fed Dot Plot Showing Projected Target Range of Fed Funds Rate
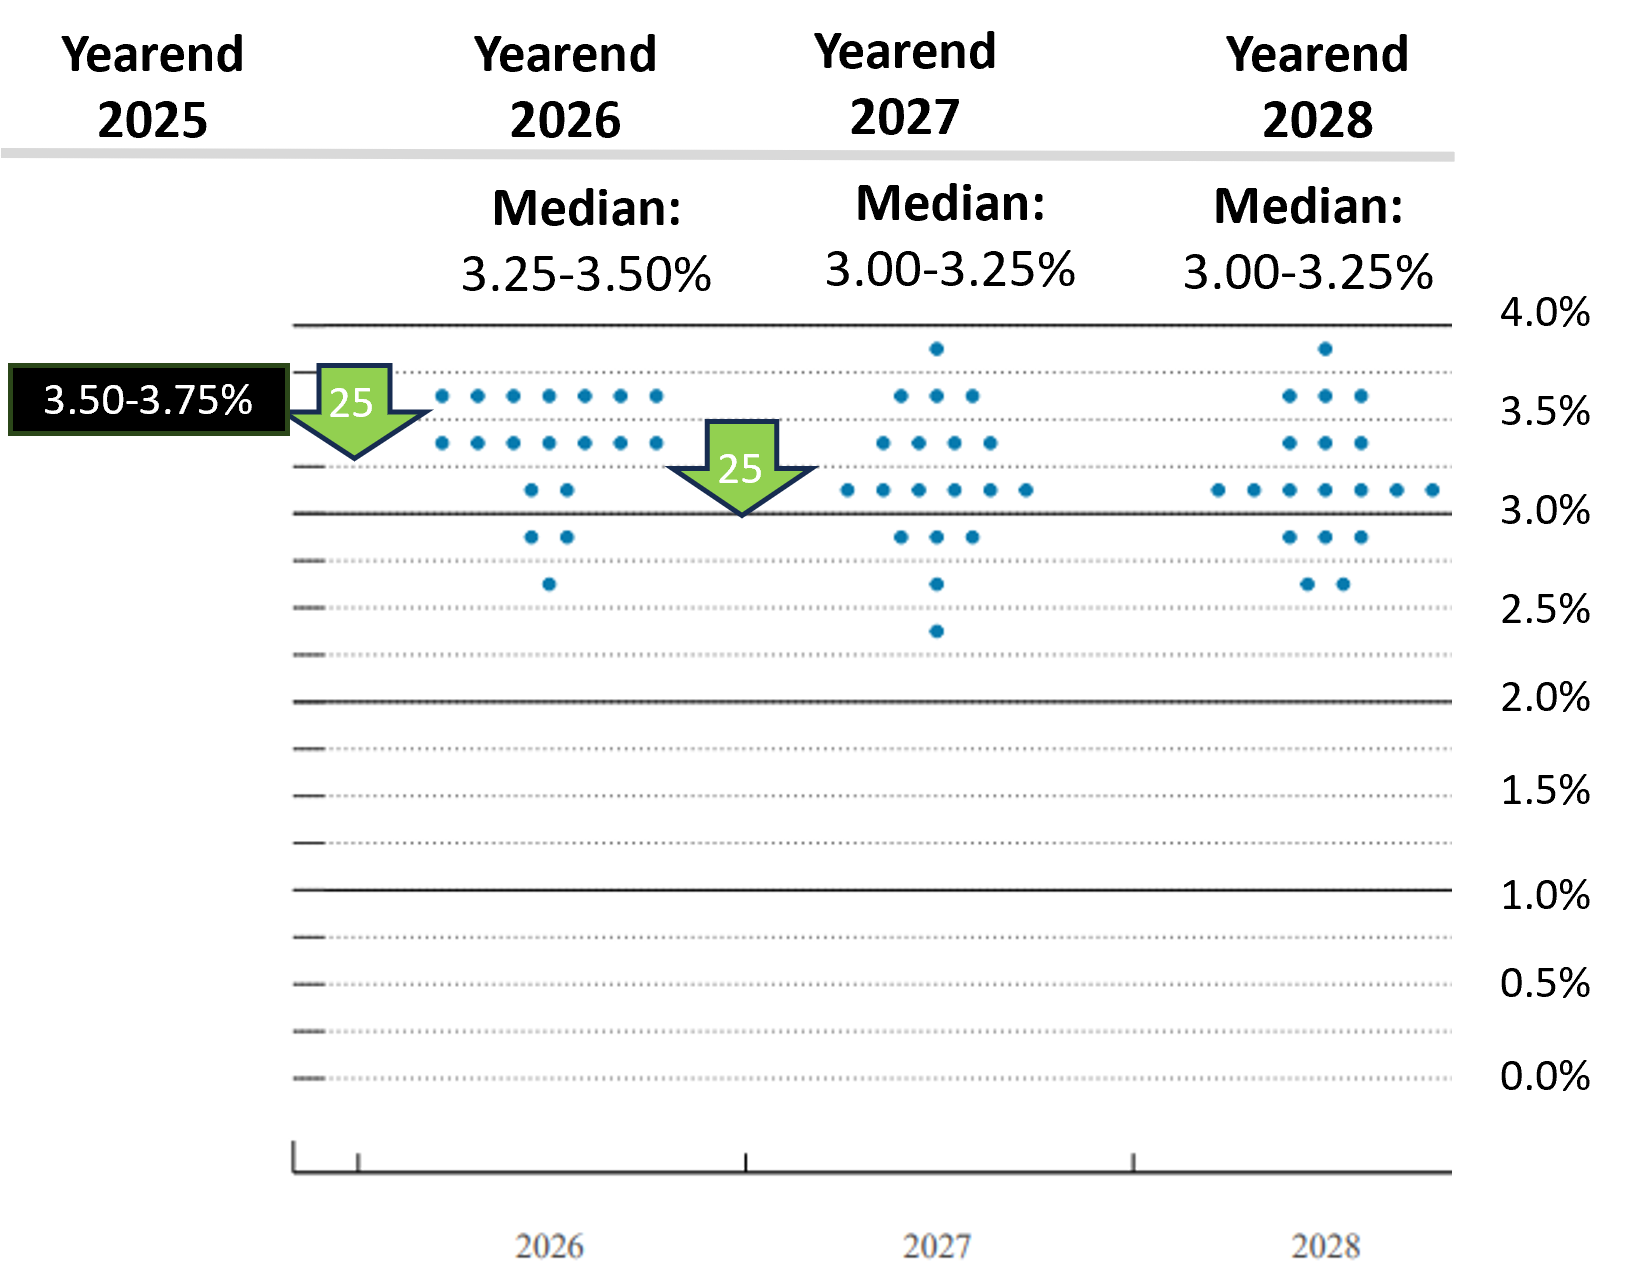
Source: March 18, 2026 FOMC Summary of Economic Projections and Bondsavvy calculations.
We compare the March 2026 Fed dot plot above to the December 2025 Fed dot plot in Figure 1a below. As shown, the median projections of yearend 2026 to 2027 fed funds rates were consistent between these two Fed dot plots. The biggest difference between the two Fed dot plots is that, in March 2026, 14 dots are clumped between two target ranges: 3.25% to 3.50% and 3.50% to 3.75%. The December 2025 Fed dot plot, as shown in Figure 1a, shows a much wider distribution of projections for yearend 2026 even though the median ranges are identical.
Figure 1a: December 2025 Fed Dot Plot Showing Projected Target Range of Fed Funds Rate
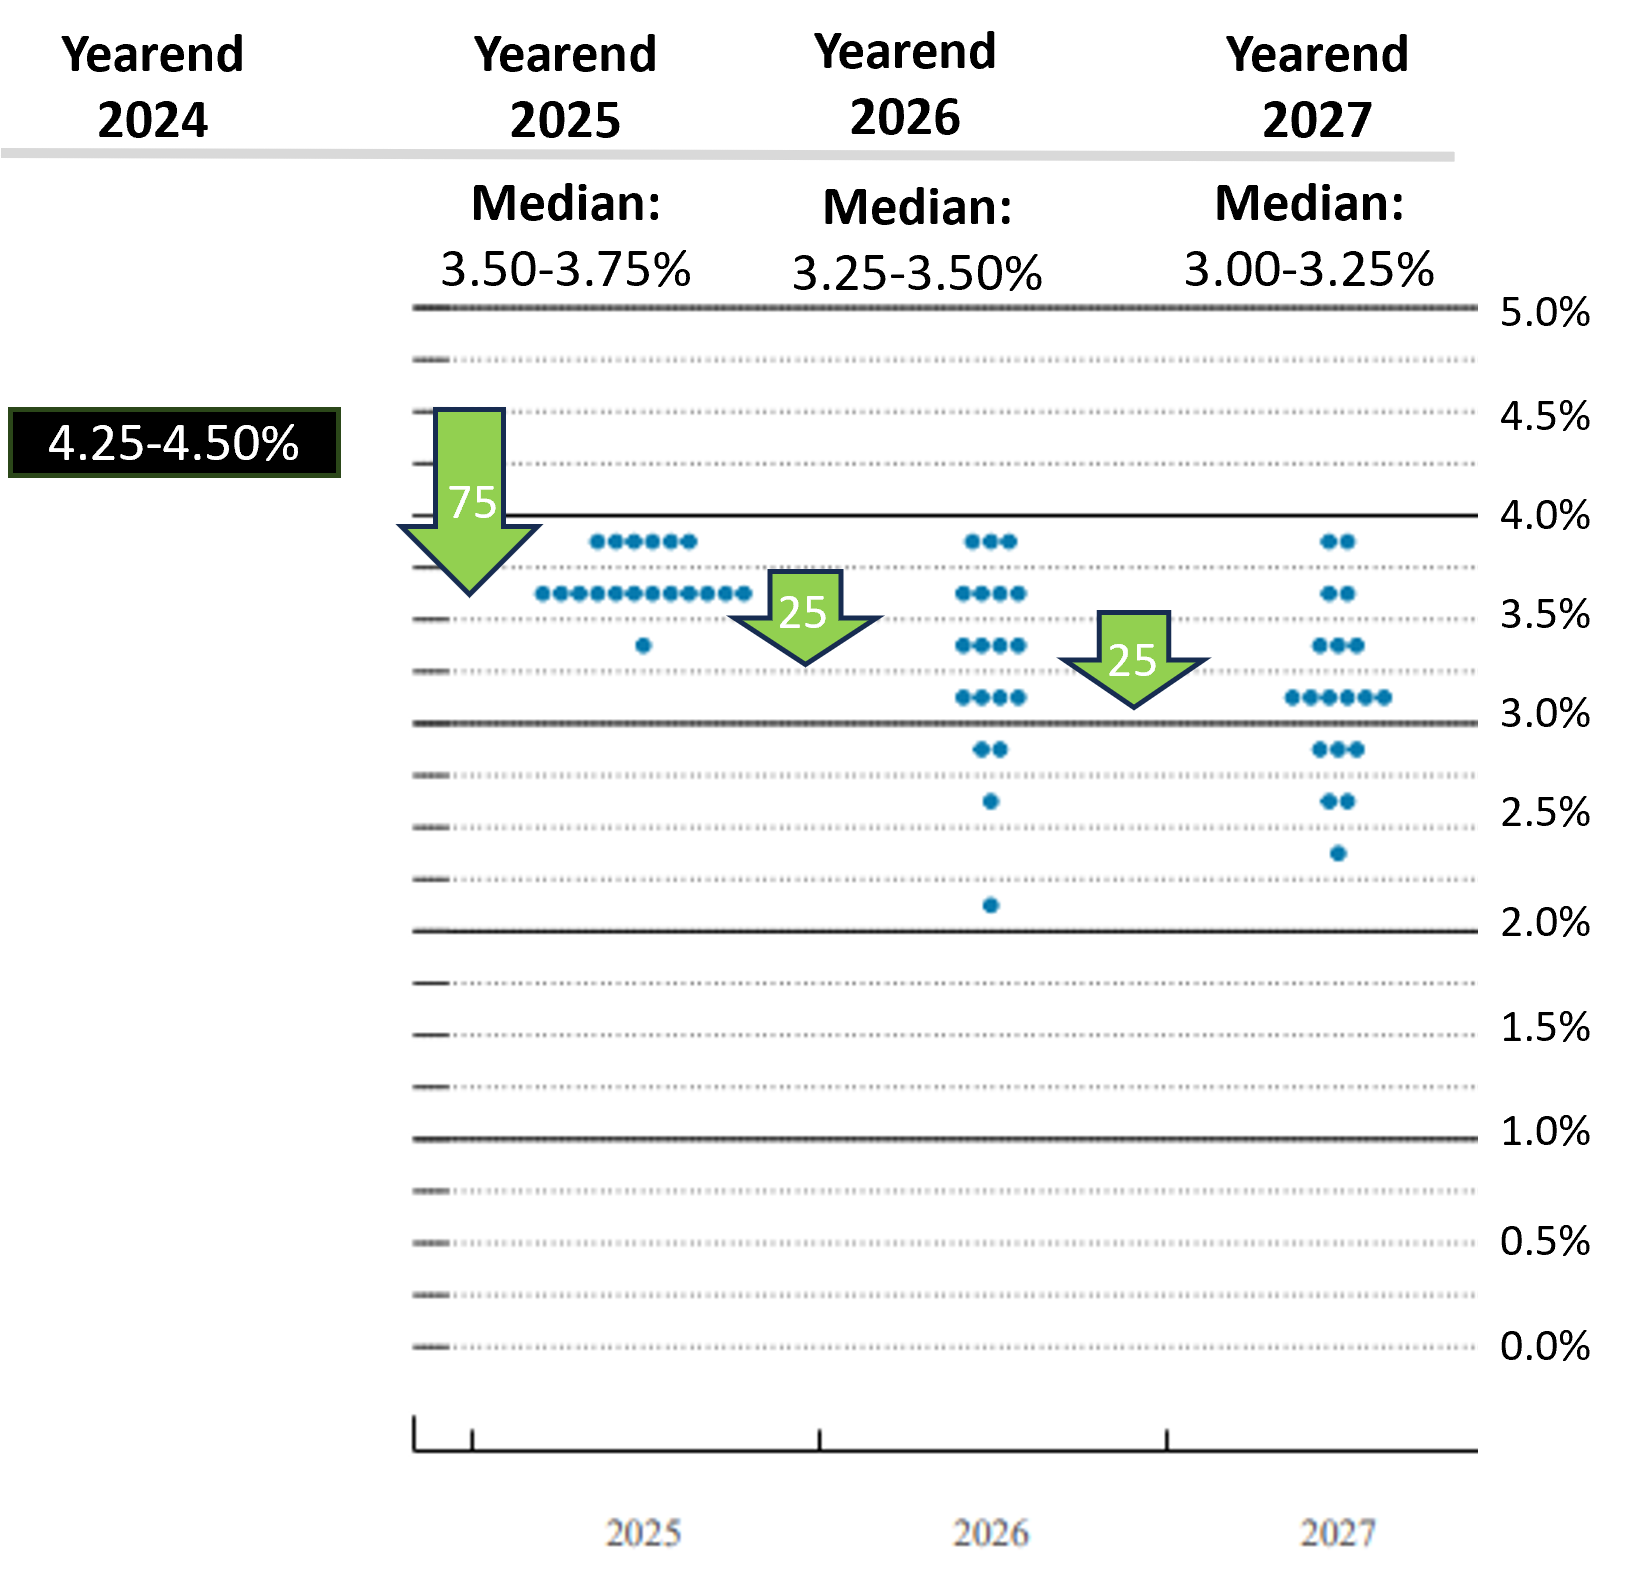
Source: December 10, 2025 FOMC Summary of Economic Projections and Bondsavvy calculations.
The FOMC Press Conference March 18, 2026
On March 18, 2026, Fed Chair Jerome Powell hosted a press conference after the FOMC released its 2:00pm Eastern Time
statement that it would be holding the target range of the fed funds rate at 3.50% to 3.75%. Figure A shows key
statements he made during the press conference, which included the FOMC's views on current economic conditions,
including growth and inflation.
Figure A: Key Statements from the FOMC Press Conference on March 18, 2026
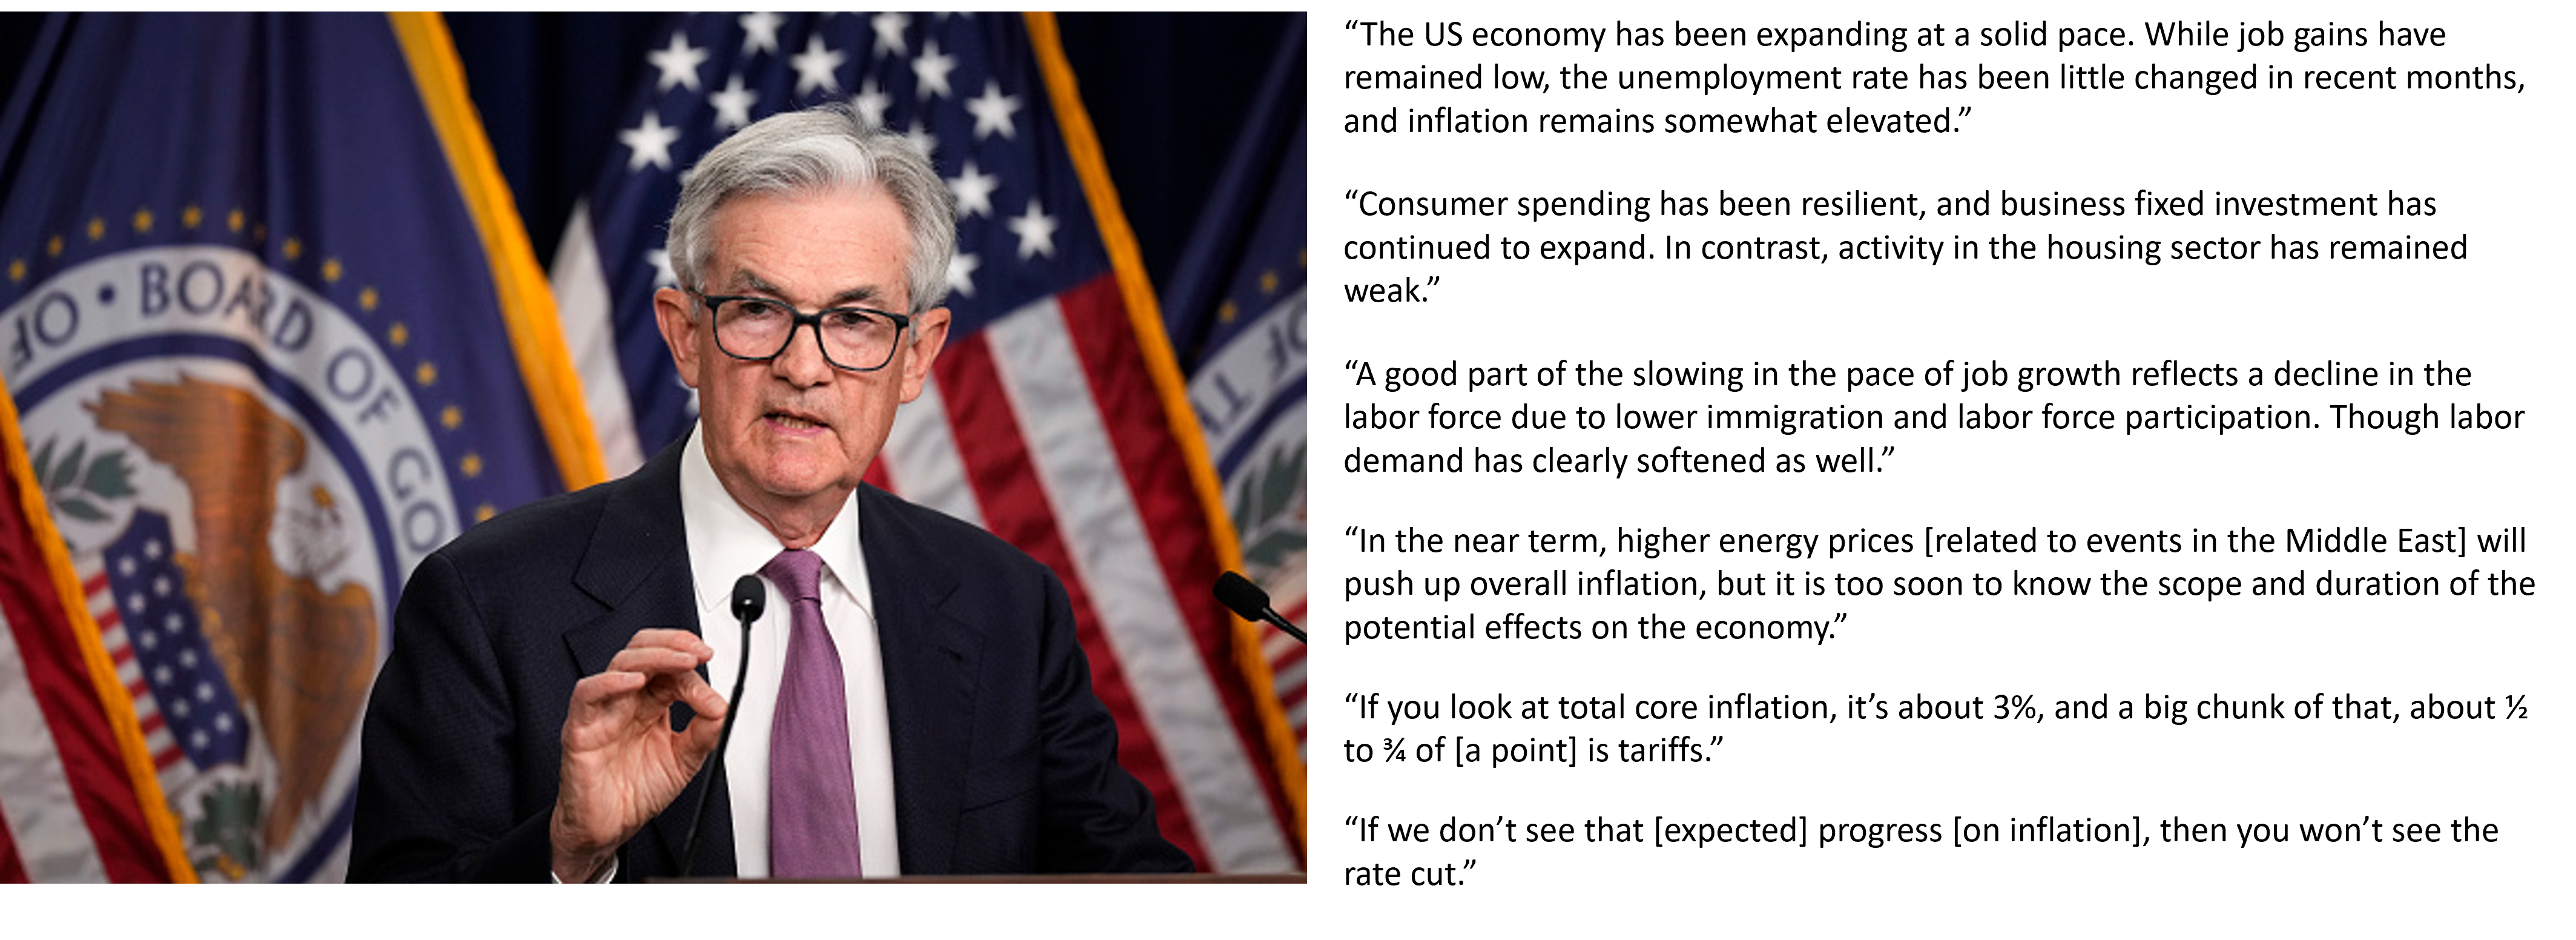
Image licensed from Getty Images.
Bondsavvy Subscriber Benefit
Steve Shaw founded Bondsavvy in 2017 to make bond investing easier and more profitable for individual investors. Our corporate bond recommendations cut through the clutter to identify bonds that
offer high total return opportunities relative to their risk.
Get Started
Summary of Last Three Fed Dot Plots
Figure 1b compares the median levels for fed funds rate cuts and the fed funds target range across the last three Fed
dot plots. As shown, the 2026 and 2027 median target ranges for the fed funds rate have been unchanged across the latest Fed dot plots. Our recent economic newsletter article shows the impact 250 basis points of Fed rate cuts
has had on US Treasury yields during the three most recent rate-cutting periods.
Figure 1b: Summary of Latest Fed Dot Plots
|
2026 |
2027 |
Total Rate Cuts ('26-'27) |
| Median Level of Rate Cuts in Given Year |
|
|
|
| March 2026 Fed Dot Plot | -25 bps | -25 bps | -50 bps |
| December 2025 Fed Dot Plot | -25 bps | -25 bps | -50 bps |
| September 2025 Fed Dot Plot | -25 bps | -25 bps | -50 bps |
|
|
|
|
| Median Yearend Fed Funds Target Range |
|
|
|
| March 2026 Fed Dot Plot | 3.25%-3.50% | 3.00%-3.25% | |
| December 2025 Fed Dot Plot | 3.25%-3.50% | 3.00%-3.25% | |
| September 2025 Fed Dot Plot | 3.25%-3.50% | 3.00%-3.25% | |
Sources: FOMC Summary of Economic Projections Reports and Bondsavvy analysis.March 2026 Summary of Economic Projections
In connection with creating the Fed dot plot, FOMC participants project key US economic data points, including
unemployment, inflation, and GDP growth. Figure 2 provides a summary of the projections across recent Fed SEPs.
As shown, compared to the previous SEP, the March 2026 SEP showed a 30-basis-point increase in yearend 2026 PCE inflation (to 2.7%) and a 10-basis-point increase in 2026 real GDP growth (to 2.4%).
Figure 2: Median Economic Projections of FOMC Participants
| Date of Projection |
2026 |
2027 |
Longer Run |
|
|
|
|
| Unemployment Rate |
|
|
|
| March 2026 | 4.4% | 4.3% | 4.2% |
| December 2025 | 4.4% | 4.2% | 4.2% |
| September 2025 | 4.4% | 4.3% | 4.2% |
| June 2025 | 4.5% | 4.4% | 4.2% |
|
|
|
|
| PCE Inflation |
|
|
|
| March 2026 | 2.7% | 2.2% | 2.0% |
| December 2025 | 2.4% | 2.1% | 2.0% |
| September 2025 | 2.6% | 2.1% | 2.0% |
| June 2025 | 2.4% | 2.1% | 2.0% |
|
|
|
|
| Change in Real GDP |
|
|
|
| March 2026 | 2.4% | 2.3% | 2.0% |
| December 2025 | 2.3% | 2.0% | 1.8% |
| September 2025 | 1.8% | 1.9% | 1.8% |
| June 2025 | 1.6% | 1.8% | 1.8% |
Source: FOMC Summary of Economic Projections ReportsHow Fed Funds Rate Changes Have Impacted US Treasury Yields
While the US Federal Reserve does not control long-term US Treasury yields, Fed policy and expectations of Fed policy
changes can have a big impact. Figure 2b compares the Effective Fed Funds Rate to the 2-year, 10-year, and 20-year
US Treasury yields. Longer-term Treasury yields impact what homeowners pay for mortgages and the interest rates
companies pay on their debt, resulting in significant impact to economic conditions.
Per Figure 2b, US Treasury yields began increasing in advance of the Fed's first rate increase in March 2022. As
these yields increased, they converged and had been moving, generally, in similar directions. Treasury yields fell
in late-2023 after reaching a peak in October 2023, but then rose again until spring 2024, as inflation remained
stubborn.
Then, in anticipation of Fed easing, there was a significant decrease in US Treasury yields across the yield curve.
From mid-April to mid-September 2024, the 2-, 10-, and 20-year yields fell 142, 101, and 84 basis points,
respectively. Yields then reversed course again, as September and October 2024 inflation reports came in hot, and
concerns over continued high US budget deficits remained.
Between September 2024 and March 18, 2026, 2-year, 10-year, and 20-year US Treasury yields have risen 20, 63, and 83 basis points, respectively.
Preview our recent economic newsletter
article to see how previous Fed rate cuts impacted bond yields and what this could mean for the path of bond
yields in the future.
Figure 2b: US Treasury Yields vs. Effective Fed Funds Rate -- January 4, 2021 to March 18, 2026
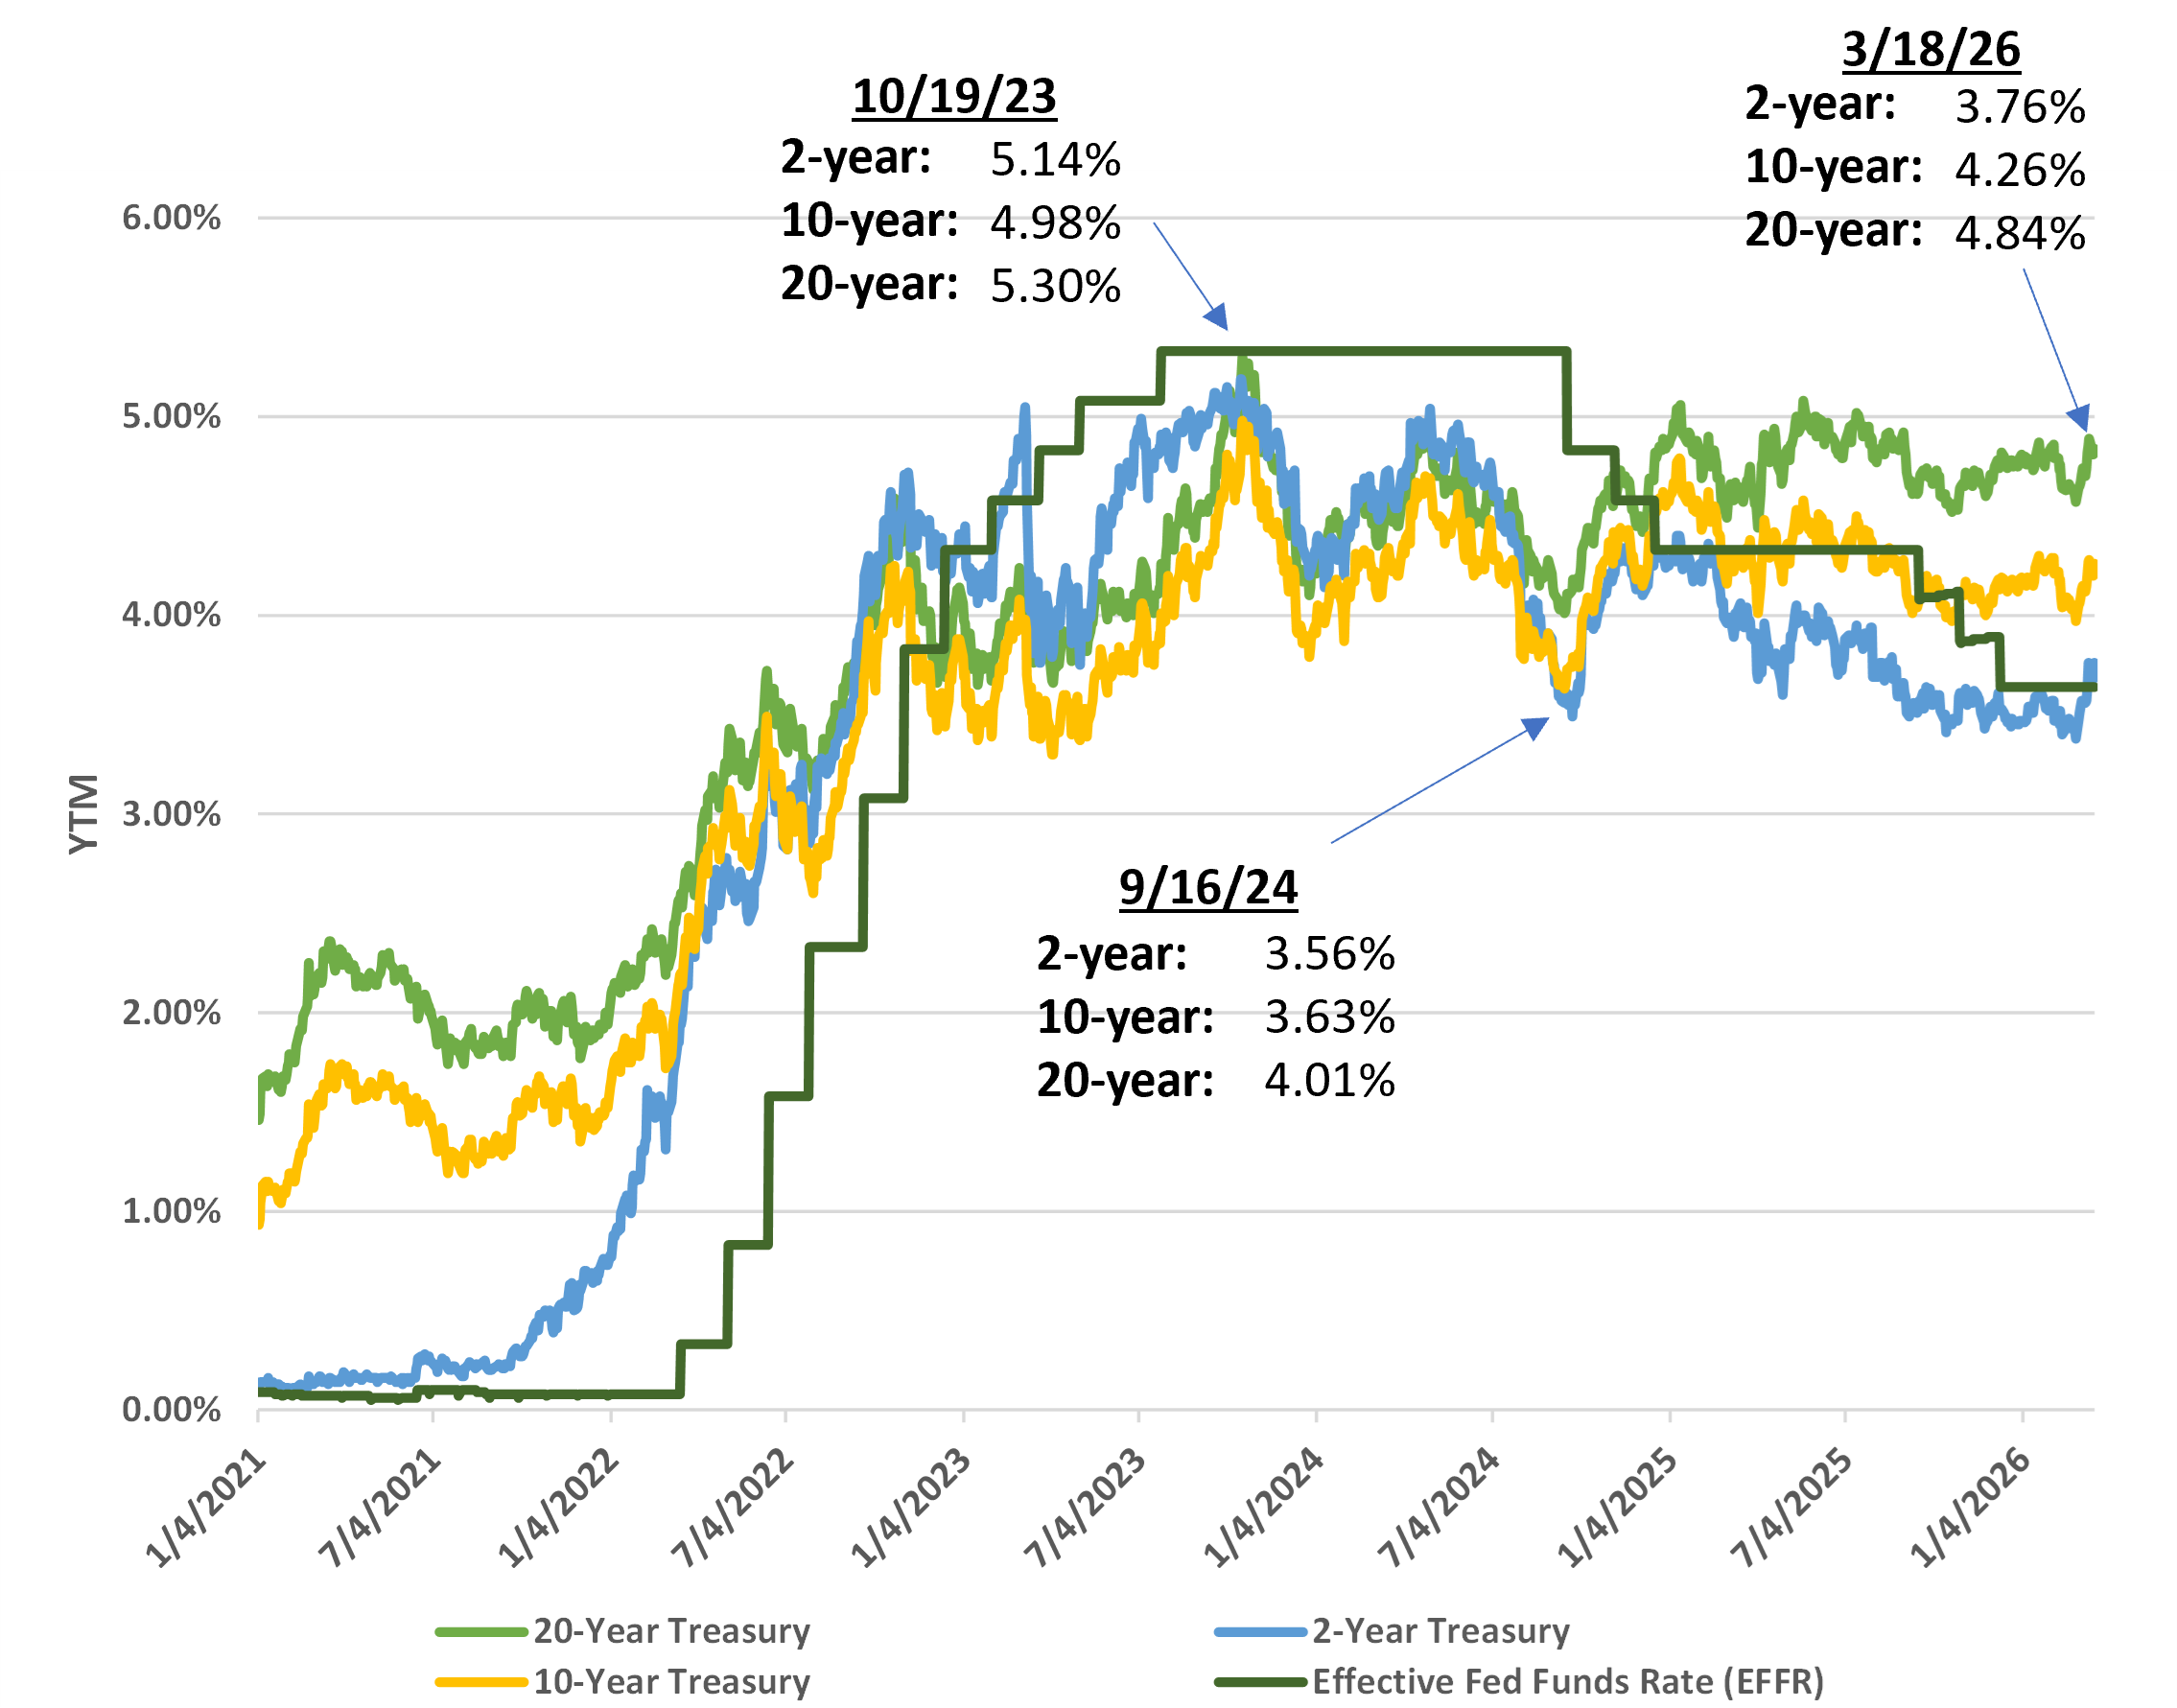
Source: US Treasury data as presented by Bondsavvy.
What the Fed Dot Plot Means for Investors
The expected downward trajectory of the fed funds rate creates advantages for individual corporate
bonds over other investments, such as money market funds and bond funds and ETFs.
Total money market fund assets were $7.8 trillion as of March 11, 2026, up $1 trillion from December 2024,
according to Investment Company Institute.
As we discuss in our Eight Reasons Not to Own Vanguard VMFXX
blog post, the VMFXX yield is highly correlated to the fed funds rate. As the fed funds rate falls, the VMFXX yield
would fall as well. In addition, since money market funds such as Vanguard VMFXX cannot achieve capital
appreciation, such investments would not benefit from an increase in bond prices associated with falling interest
rates.
Money market and bond fund distributions vary each month, and investors cannot lock in income the way they can with
individual bonds. In our VMFXX yield blog post, we discuss
how high-quality US corporate bonds have advantages to Vanguard VMFXX, including higher potential returns, lower
fees, and higher credit quality. Individual corporate bonds allow investors to lock in high yields for 5, 10, or 20+
years and to benefit from capital appreciation opportunities. Neither of these key investment objectives is
possible with money market funds.
Bondsavvy has added 27 new recommended corporate bonds to its Premier Service since November 2024, with pick date yields to maturity ranging from 4.72% to over 9.00%. Our active fixed income investment strategy seeks to achieve total investment returns higher than purchase-date YTMs, as we show in our corporate bond returns page. We also recently launched our Bondsavvy Basic service, which provides a smaller number of recommended bonds than the Premier service. We update our bond recommendations each quarter, and will update our Basic recommendations on March 20 and our Premier recommendations March 26.
Become a Bondsavvy subscriber to gain immediate access to our current investment recommendations and to be the first to learn our March 20 and 26 updates.
Get Started
Watch Free Sample